First steps
Introduction
2D Analyzer is the 2D analysis tool for complete data visulalization and further processing of measurement data.
Beside displaying of measurement data the 2D Analyzer consists of several other sub-applications:
CalcTool for further data processing
Various plots and tables for visualizing data
Video Plugin for displaying synchronized videos to measurment data to have audiovisual component to analyzation
Export functions
2D Analyzer with Demo Data
Addtional manual
2D Analyzer is, beside racing, also very suitable for multiple developmental tasks as Automotive testing, Mountainbike development or several motion analyzations. To see examples of the different purposes for which 2D Analyzer can be used, click here!
Demo Data
Demo events with measurement data are also installed with each race installation.
Important
These demo events can be found in the RaceData directory (e.g., C:\RaceData) in folder DemoData
Important
These demo events can be opened without a license!
Analyzer windows
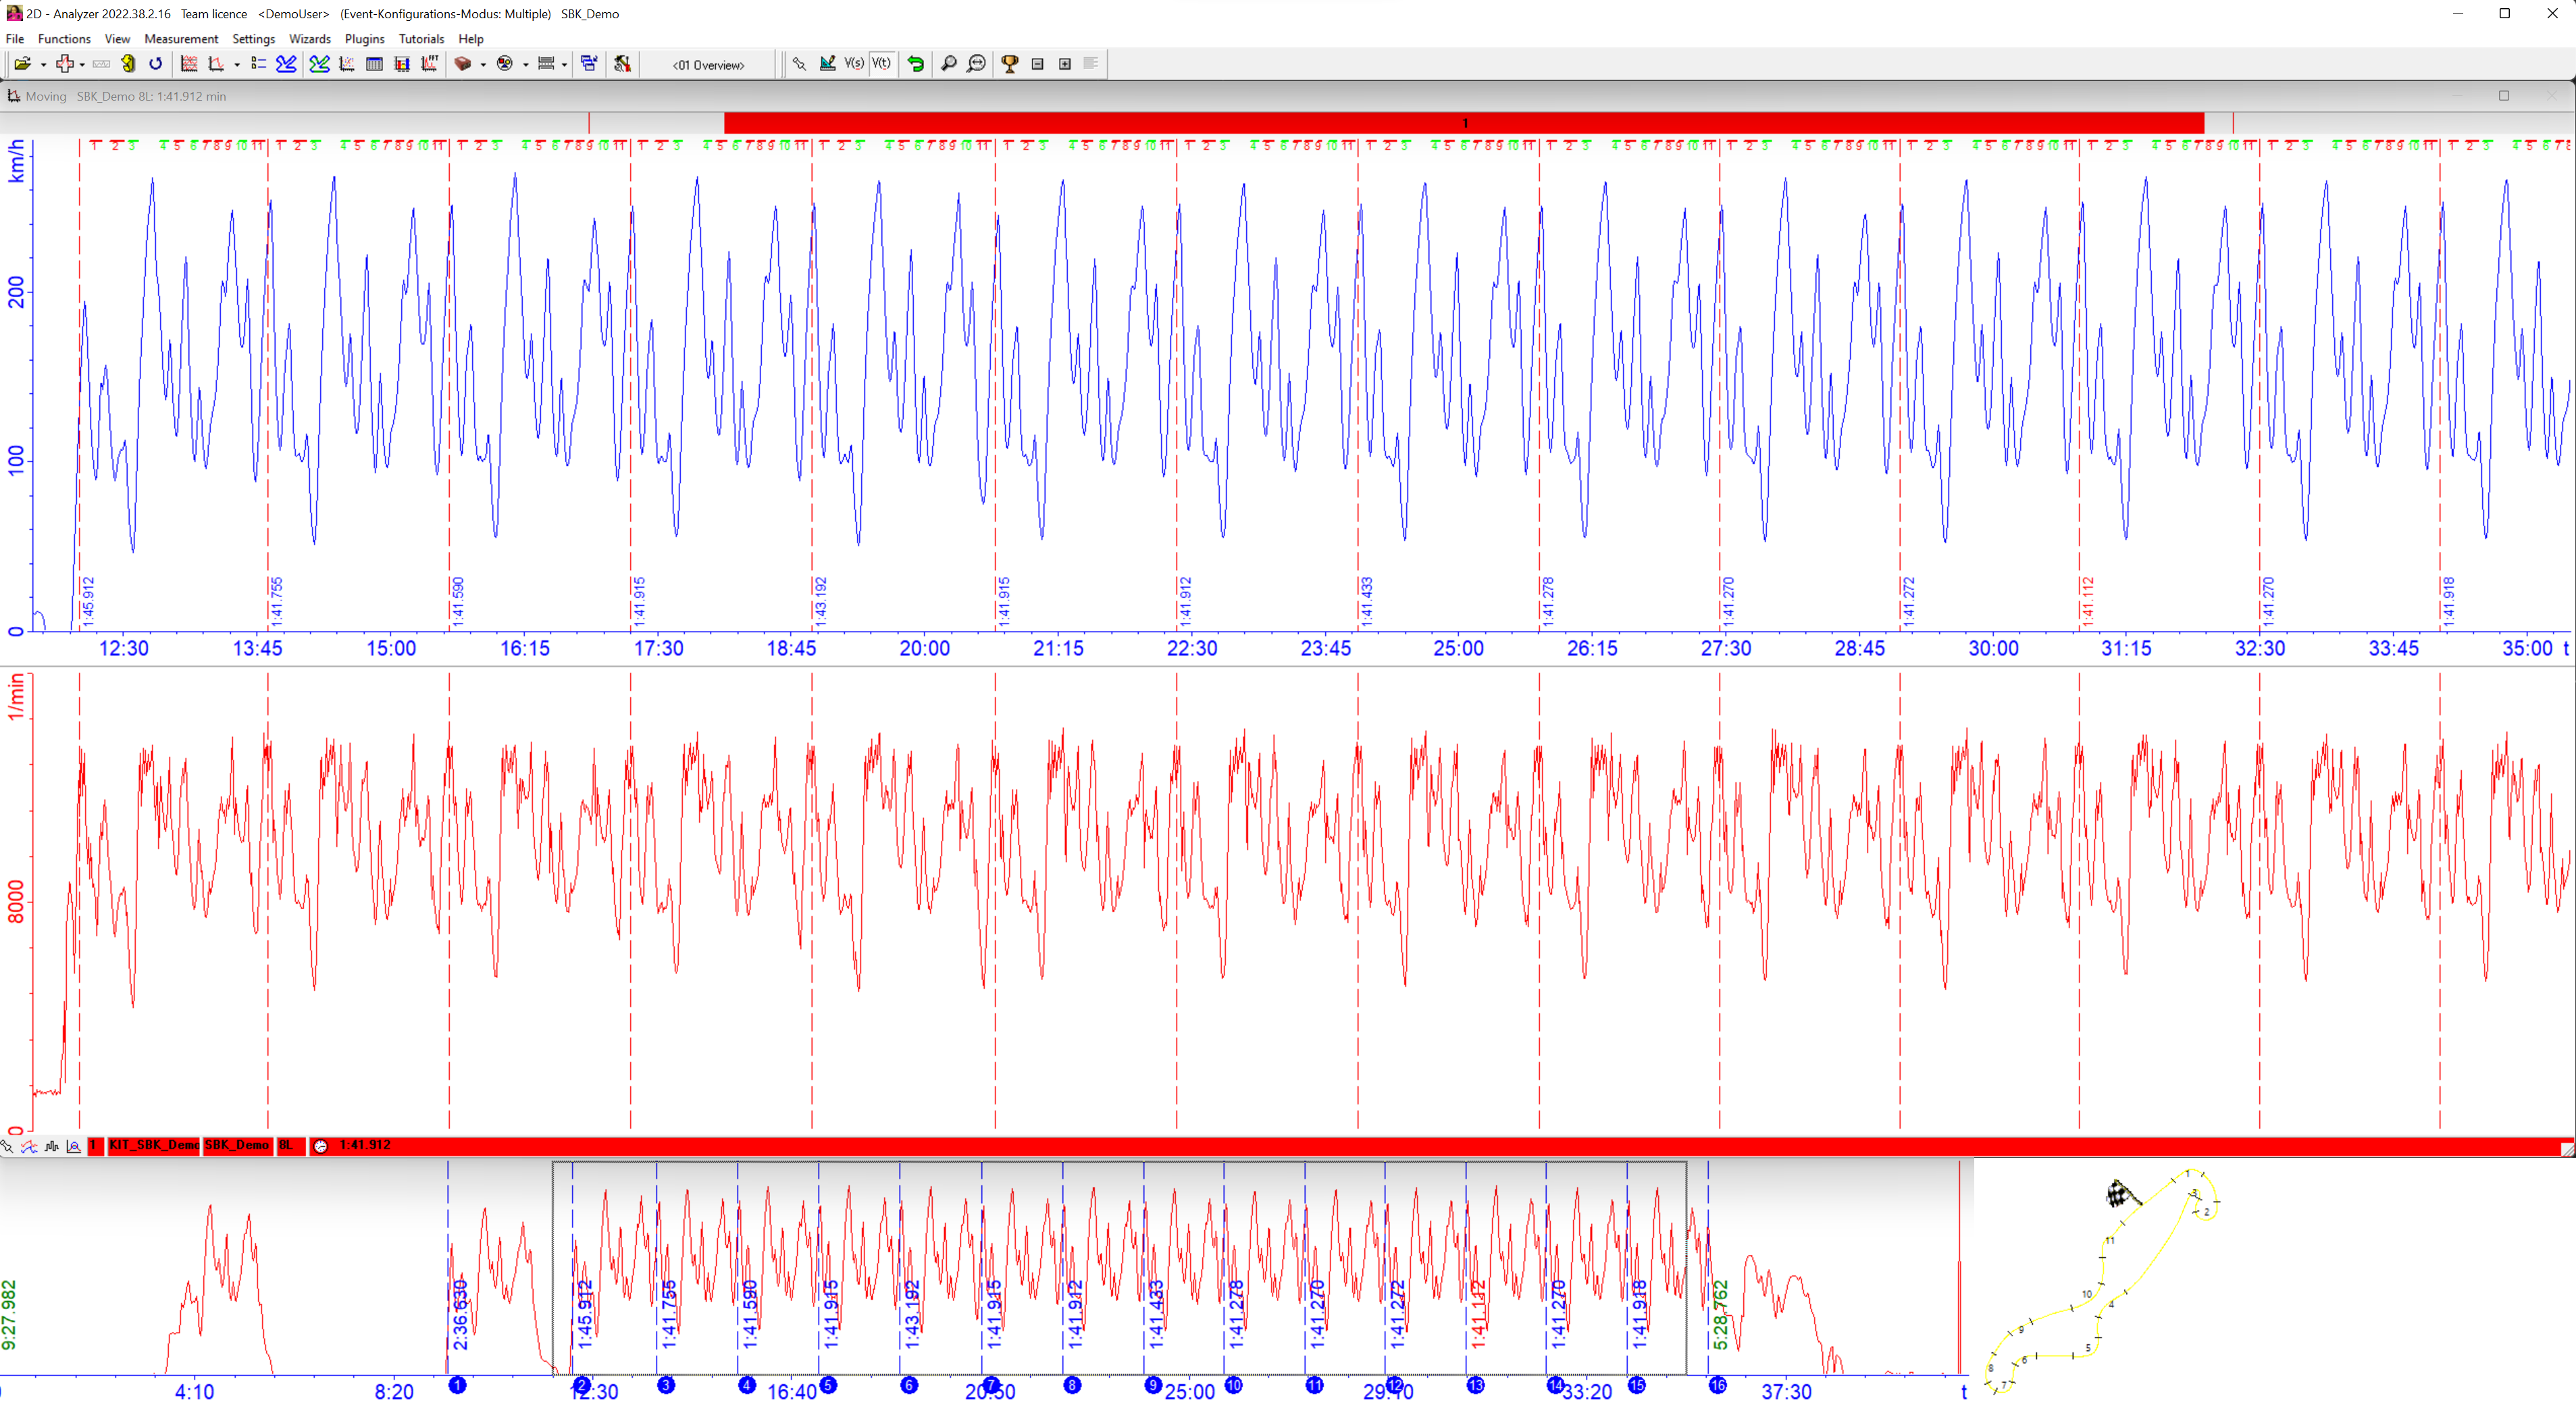
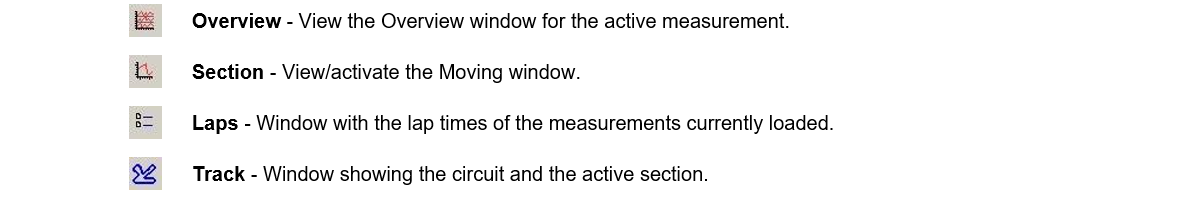
A typical Analyzer desktop consists primarily of the following three main windows:
Header window
Moving window
Overview window
Attention
All windows in 2D Analyzer can be positioned as desired by the user and saved by the user for next use.
Header window
The main menu and the toolbar are in the header window at the top of the screen and contains very important icons for navigation and software functionality.

2D Analyzer - Header
Moving window
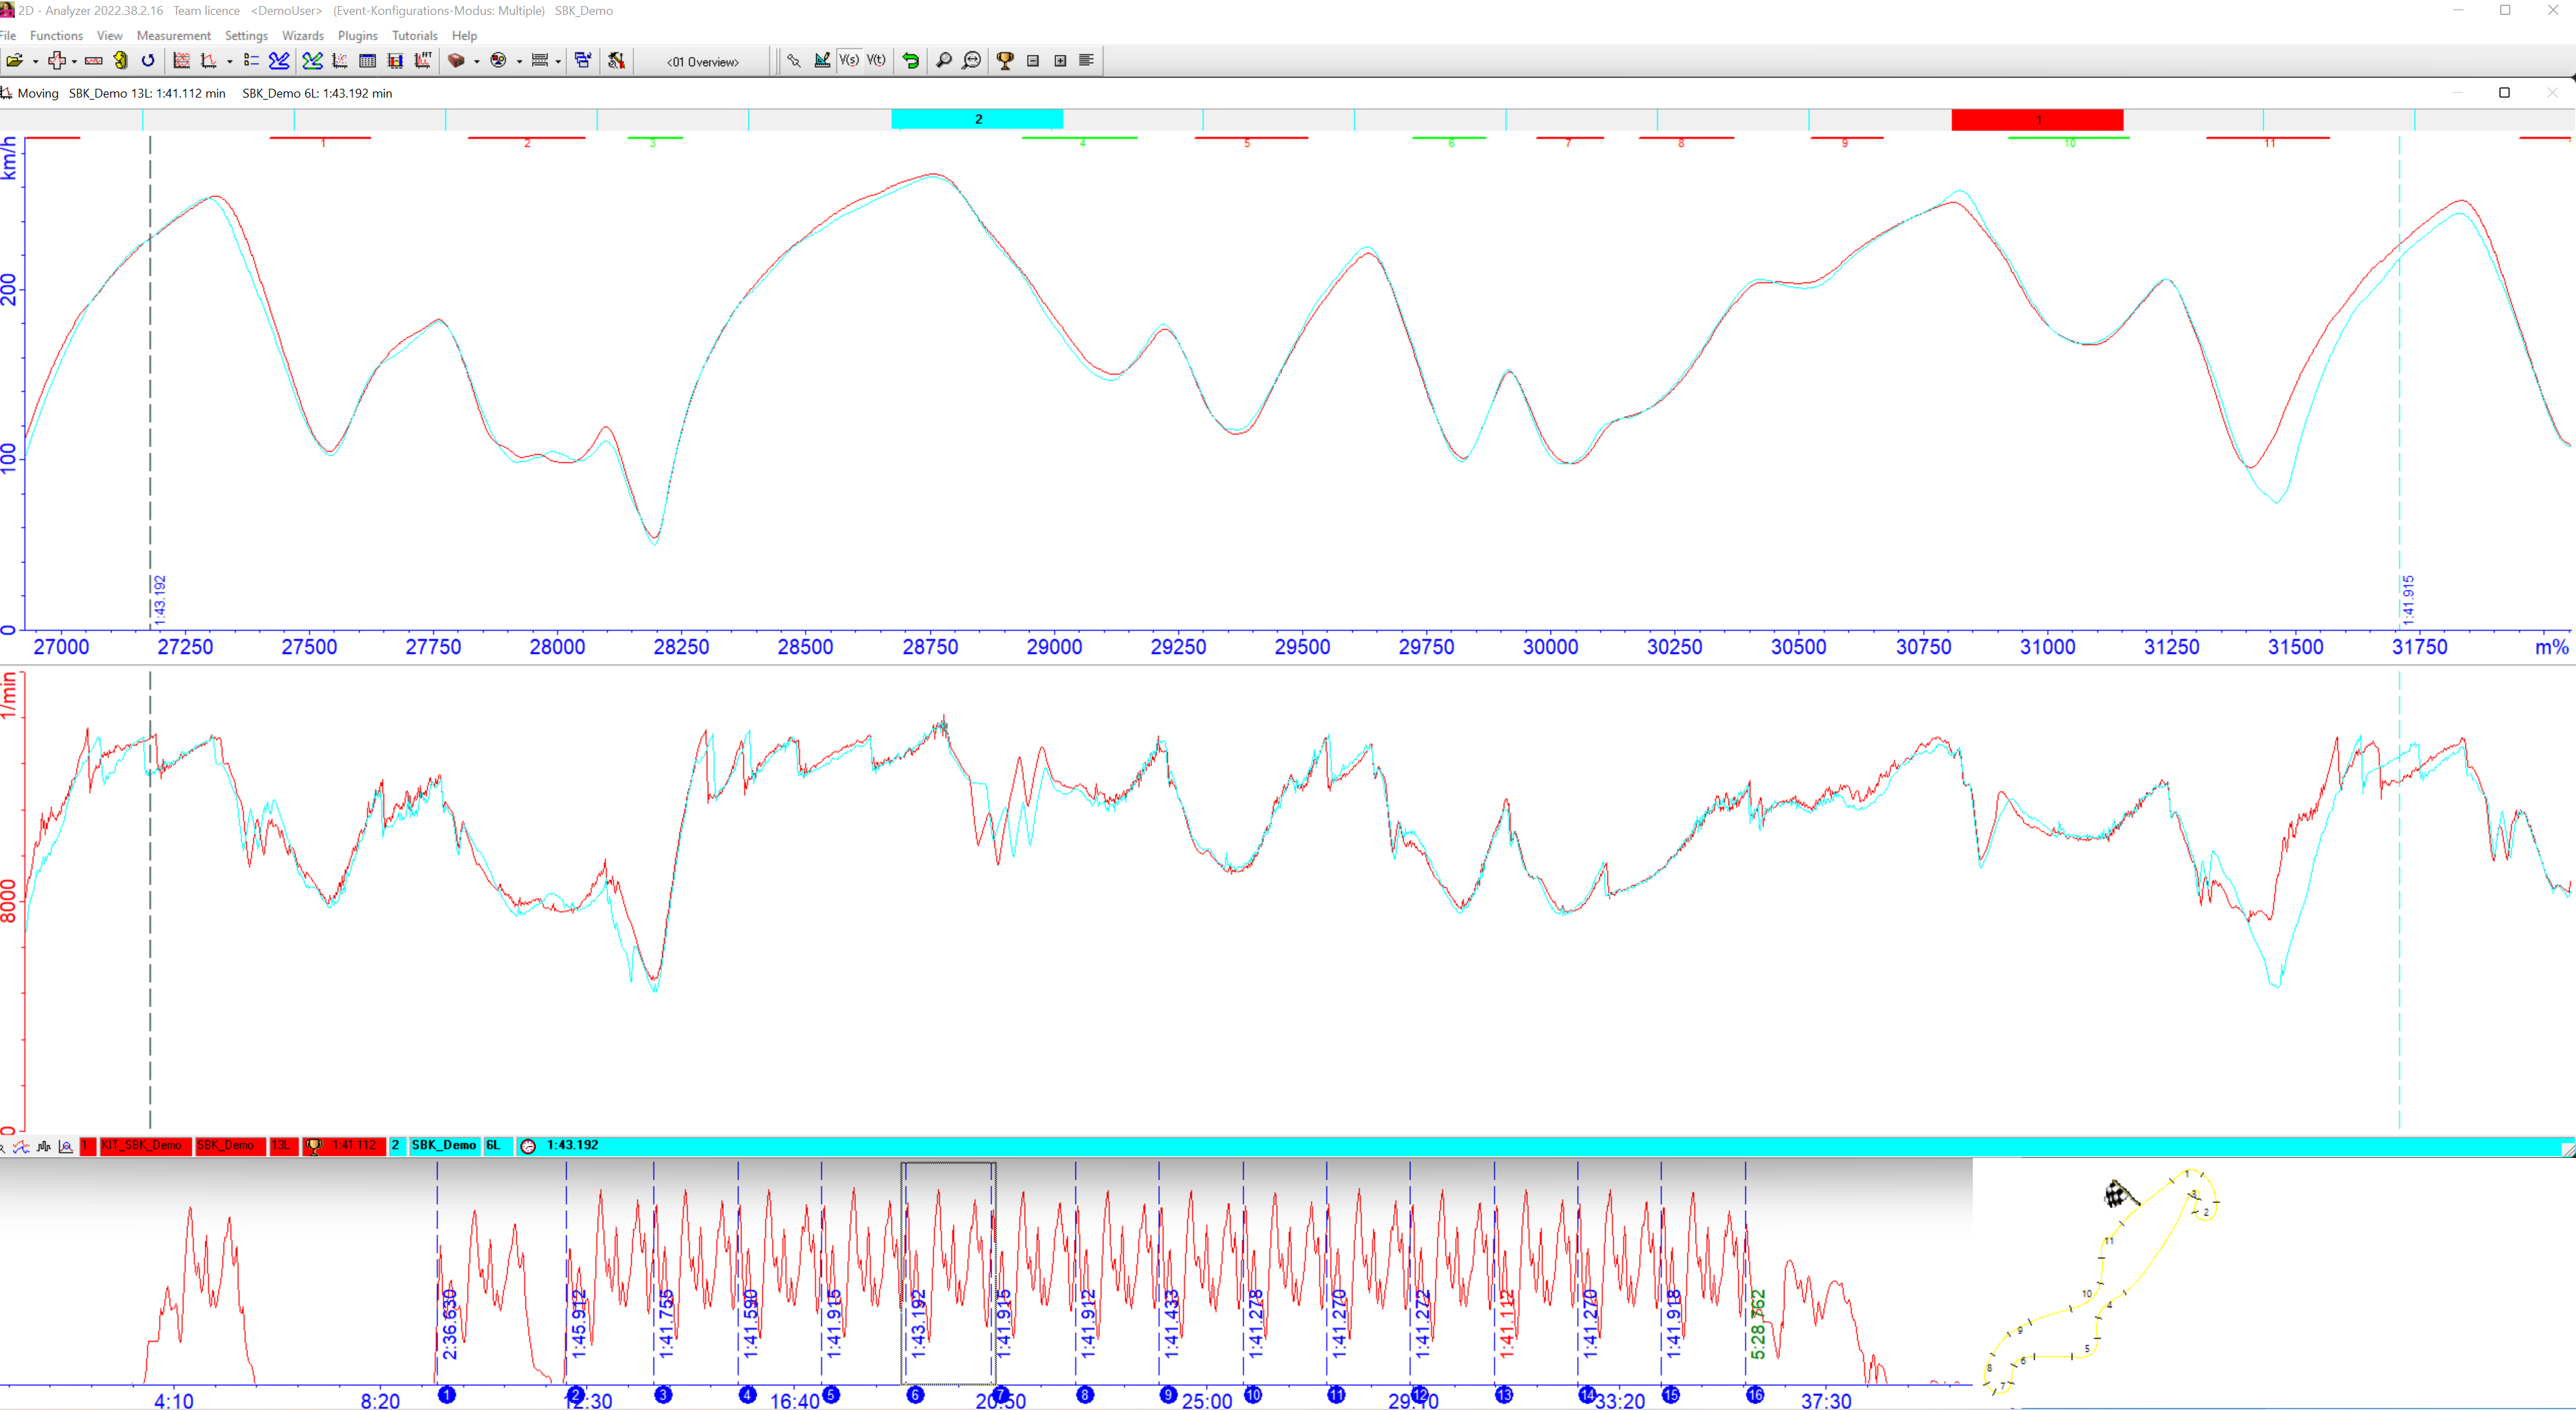
The biggest window takes up the centre of the screen and is called Moving window or survey window.
This window is used to work with the detailed information of the channels and for comparing different channels (also from a different measurment) to each other.
Important
To zoom in and out of Moving window, hold left mouse key and move mouse for- and backwards.
Attention
Moving window thus not always shows the complete measurment data but details of measurment data can be displayed!
2D Analyzer - Overview window
Areas
If many channels are displayed in the Moving Window, it can quickly become confusing.
Therefore, you can add so-called Areas by right-clicking in the Moving Window.
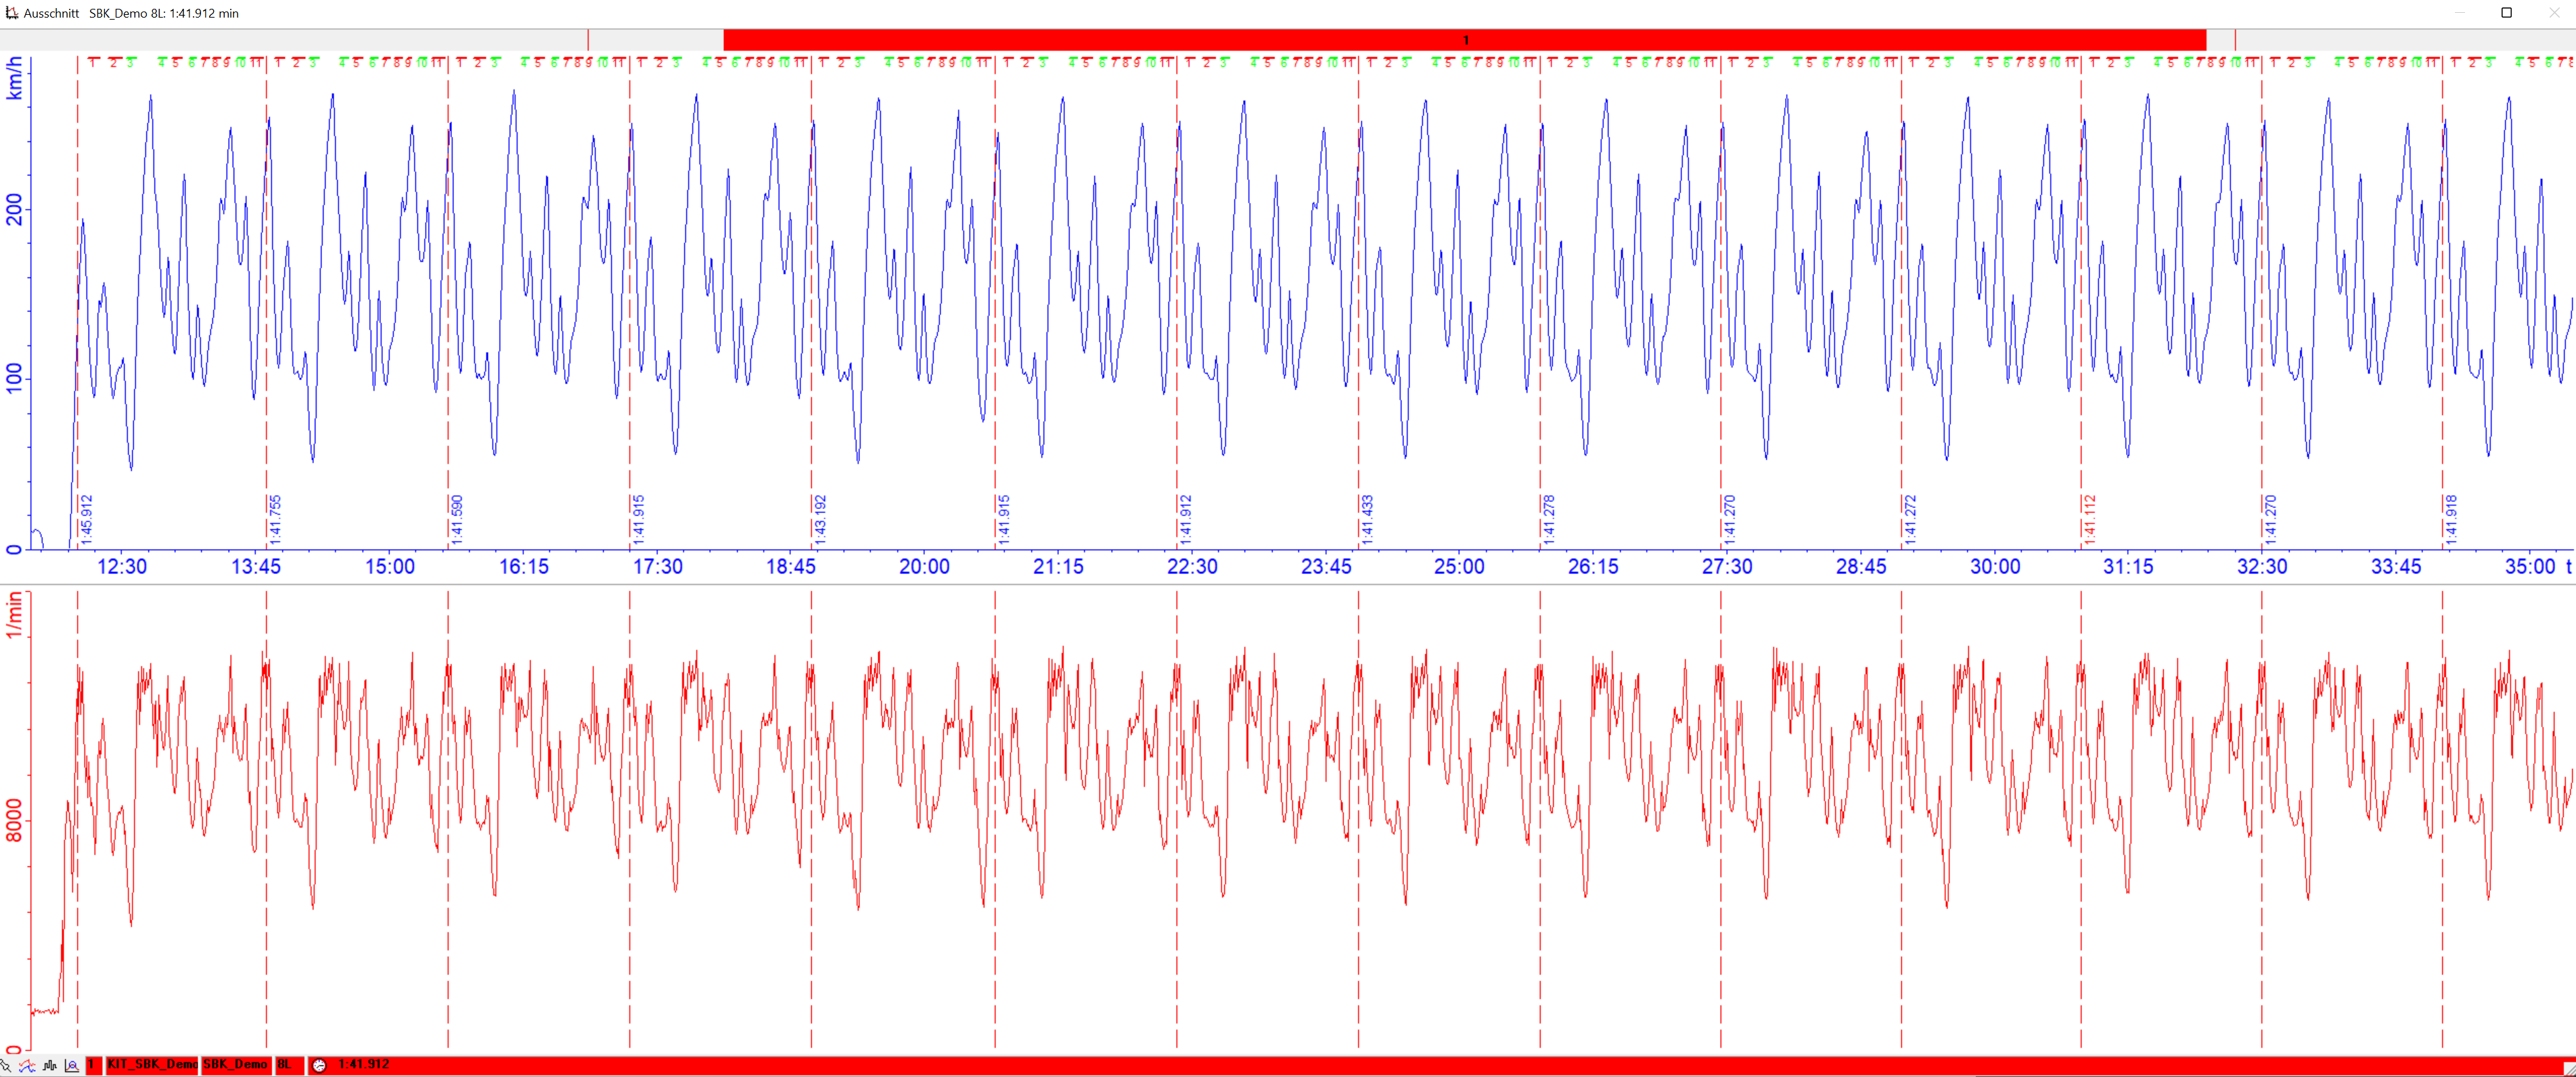
2D Analyzer - Overview window with one Area
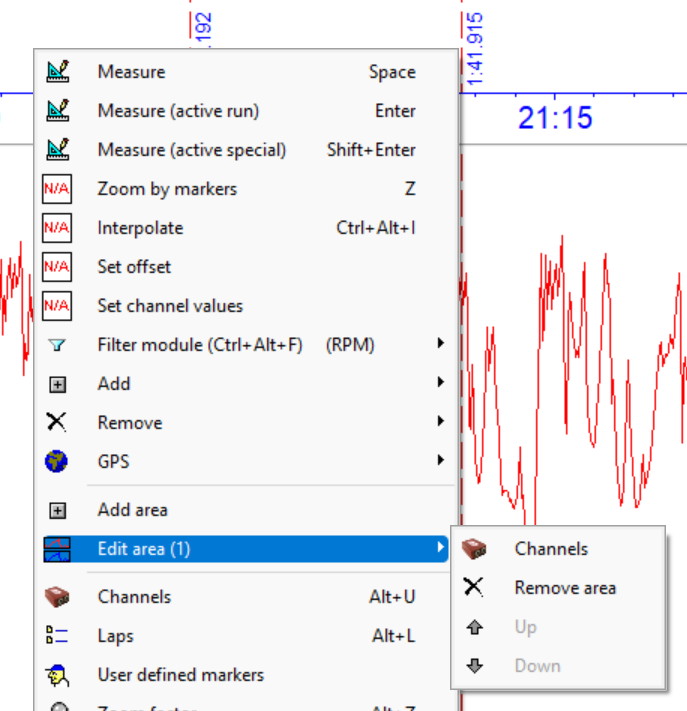
Adding/editing area via right-clicking in Moving window
Important
Up to eight areas can be added.
Overview window
The Overview window (mostly at the bottom of the screen) always shows the complete duration of the currently loaded measurement.
The gray rectangle shows which part of measurment is currently shown in moving window.
2D Analyzer - Overview window
Important
When click and hold on borders of the moving window the size and thus part of measurment to be displayed in moving window can be changed.
Templates
All Analyzer windows and sub-modules of the Analyzer (Video Plugin, plots, CalcTool windows, track plots, …) can be arranged by the user individually on the desktop (also on several screens).
These views can be saved as so called templates, so that the same desktop view can be used for all other measurements.
Important
With the help of templates, the software user can prepare templates for many different purposes (engine, suspension, GPS, laptiming, speed gear, …) in order to be able to react quickly to situations (in everyday racing or development).
Important
At some windows by default the border is disabled and thus can not be moved on the screen. Then border style must be switched via right-click and submenu or pressing CTRL + B.
Save template
Via Header window the current organisation of desktop can be saved as a template.
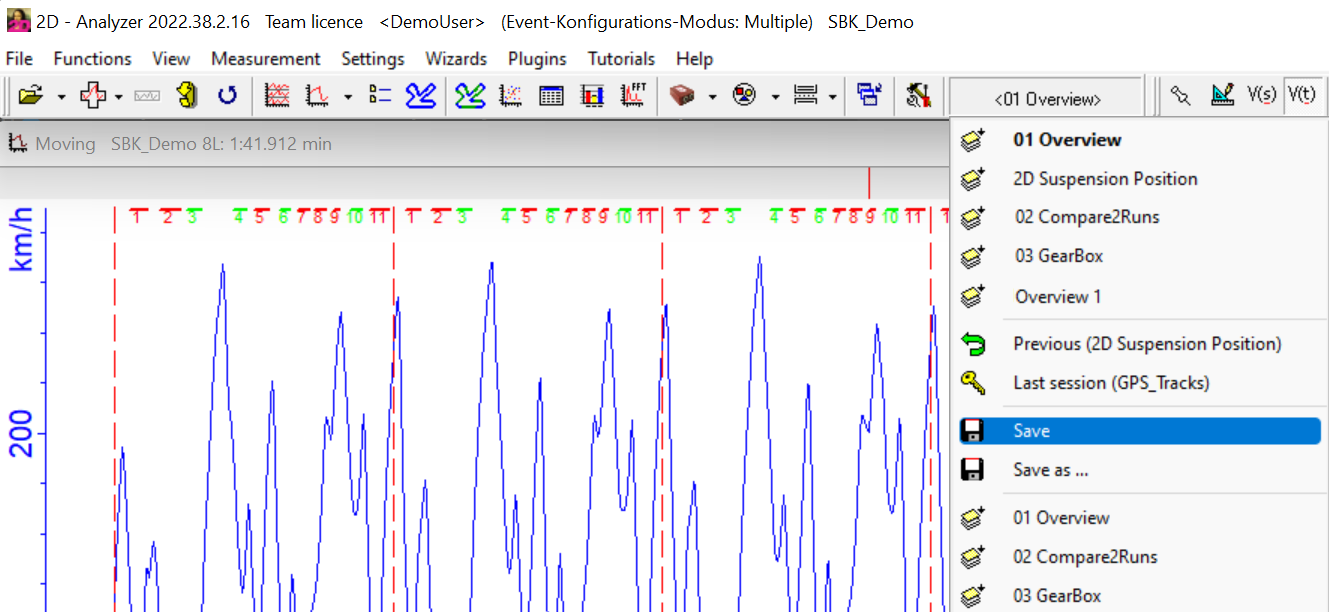
Save current desktop organisation as template
Attention
When template changes (new channels displayed, new plots displayed, …) should be made permanent, the current template must be saved again (also before switching templates)
Rename/Delete template
To the delete or rename templates via Header-menu Settings the template menu can be opened.
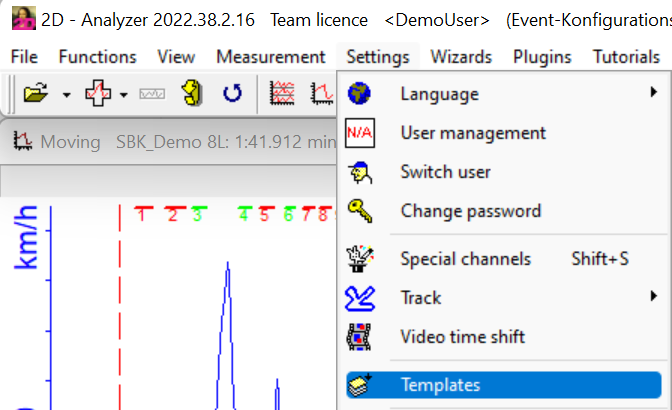
Renaming or deleting templates via template menu
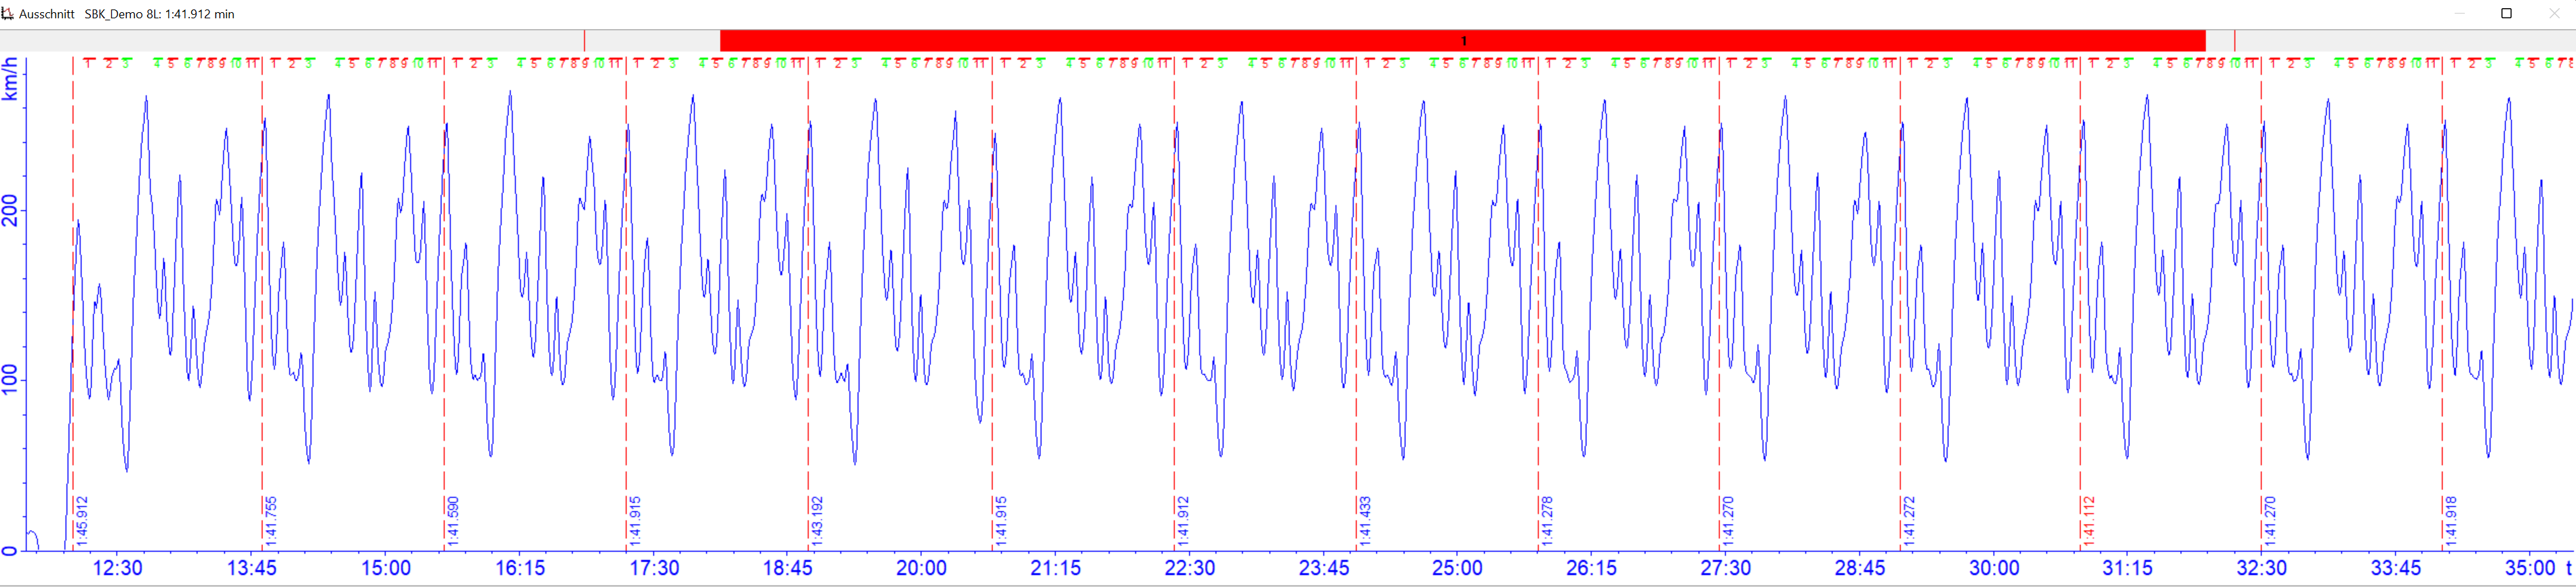
Laptrigger
In 2D Analyzer can be created via the following ways:
at recording via logger
via GPS Position (GPS line file)!
via CalcTool command
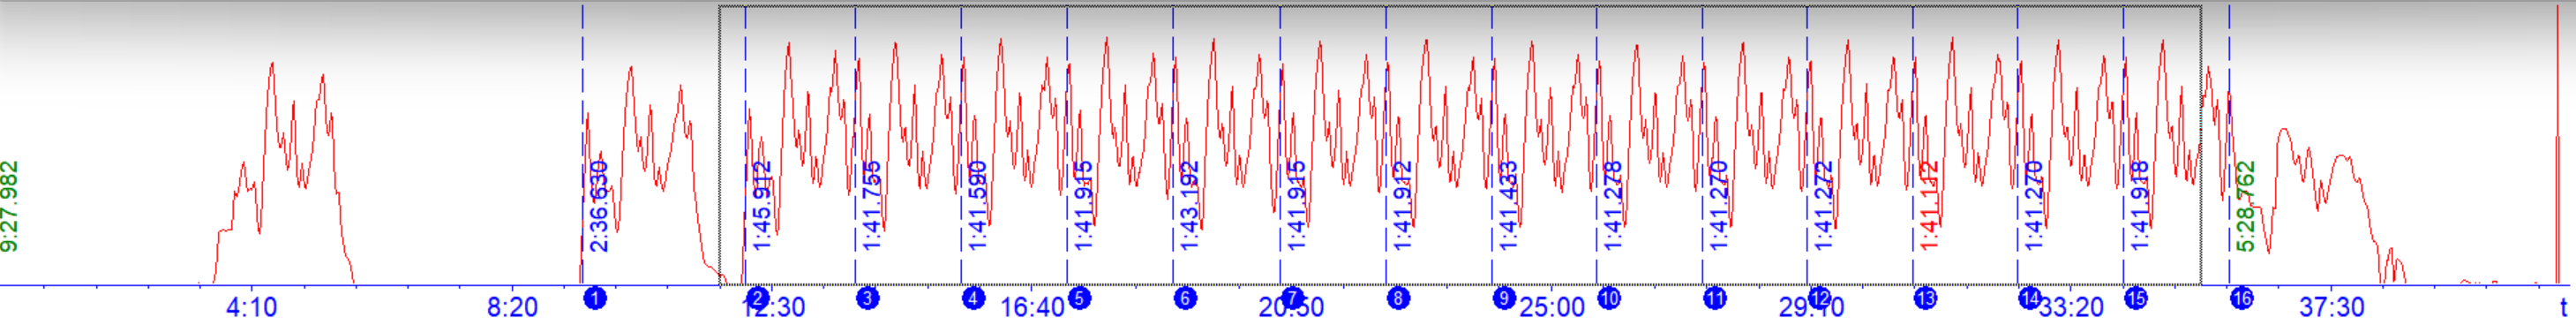
In Analyzer laptriggers are displayed as dashed, vertical lines (in moving window in red, in overview window in blue) which are used to seperate laps.
2D Analyzer with laptriggers
Important
Laptriggers are very important for MinMax-tables and X-Y-Plots.
Important
In Moving window and Overview window the fastest laptimes are shown in red!
Further use of laptriggers
In developmental projects or CalcTool toolchains, laptriggers are used for specfied “events” like:
Biathlon: Shoot detected by Accelerometer sensor triggered by the recoil of the weapon
Trampoline gymnastics: Jump detected by Accelerometer sensor at the point with the greatest acceleration in the cloth
Vehicle testing: GPS/GNSS positions created by GPSTracks toolchain
Important
In racing a laptrigger means a subdivision, e.g. of a MinMax table in lines (to output values per lap). Also in development projects the nomenclature of a “laptrigger” remains, however, here the difference is that these are used e.g. for triggering by GPS/GNSS position or by “event” defined by CalcTool. By the Laptrigger later for measuring data evaluations in MinMax tables or exports a line per “Event” (per round) is available.
Deleting laptriggers
If laptriggers created by CalcTool, the laptriggers can be deleted via Analyzer menu File
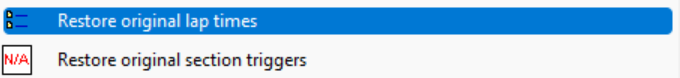
Delete (Restore) Laptriggers in Analyzer
Attention
Laptriggers created while recording from logger can only overwritten but never deleted completely and restored every time via shown button!
Measurement/Lap overlay
In Analyzer multiple measurements can be loaded as overlay to compare channels of other measurement or laps.
Important
The channels of the different measurements are all colored in the respective measurement colors (e.g. red and blue) to distinguish the channels.
Important
When comparing two laps of measurement it is suggested to switch to distance plot.
Addtional manual
Detailed information about laptiming in Analyzer and comparing measurements click here.
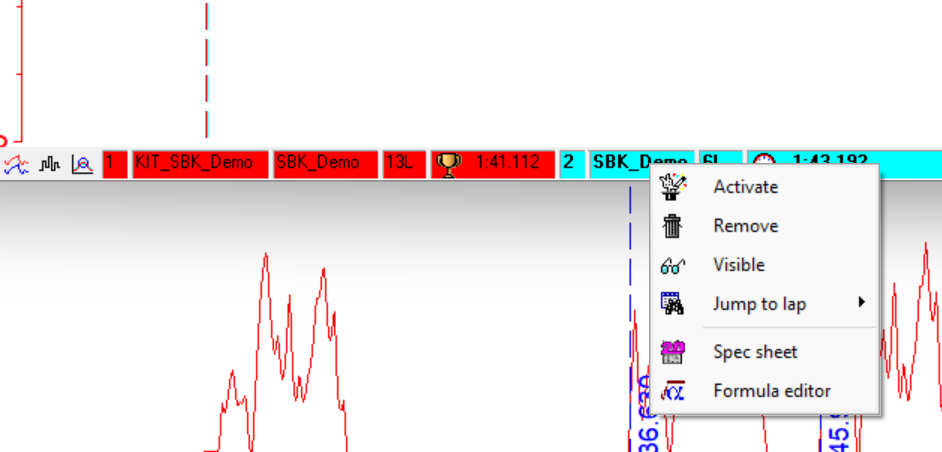
Activate/Deactivate loaded measurement
Via right-click on measurement name the respective measurements can be actived or deactivated.
Important
If the measurement is currently activated, the measurement name in moving window bar is displayed in bold.
Important
Activate/Deactivate measurements: Also number keys can be used to switch between the measurements!
Important
Entering activated measurement: Using “Enter” to only acitvate currently selected measurement (Channels are then displayed in “real” colors again)
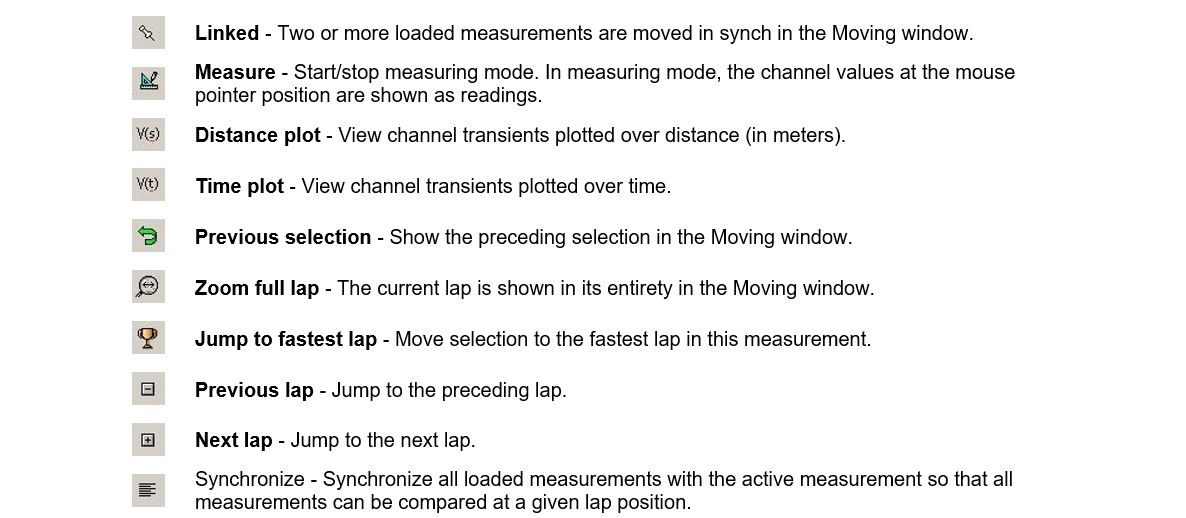
Header window icons
File functions
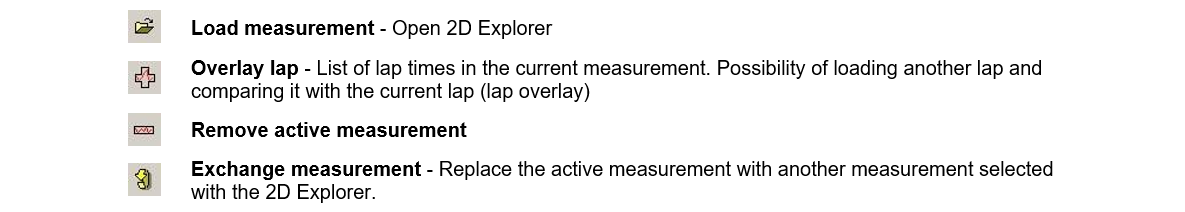
Basic Analyzer functions
Advanced Analyzer functions
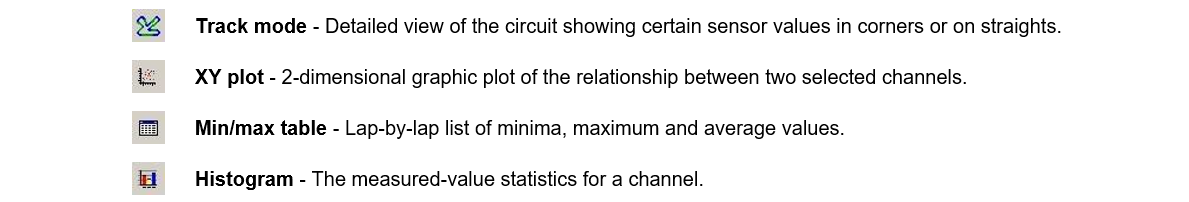
Visibility of channels

Additional Functions

Templates

Lap and measurement functions
Channels
All channel settings can be done via the channel list which can be opened via Analyzer toolbar or by pressing <CTRL>*+*<u>.
Analyzer toolbar channel list icon
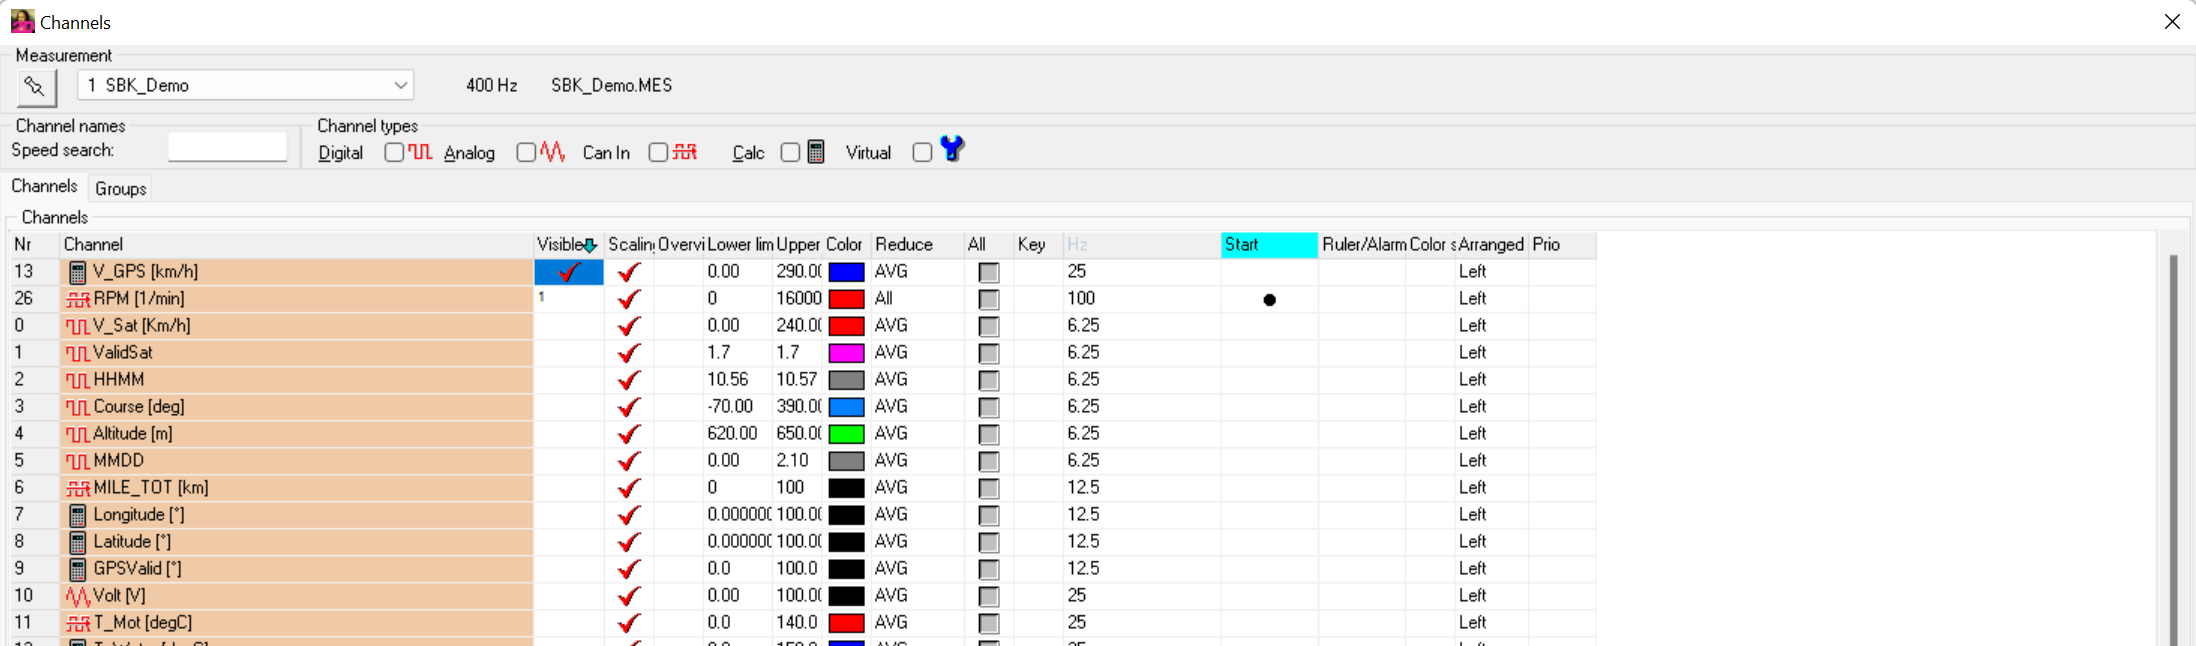
Channel list
Channel list in detail
Beide channel list, also via right-click on respective channel in measured-value window, the channel settings can be opened directly.
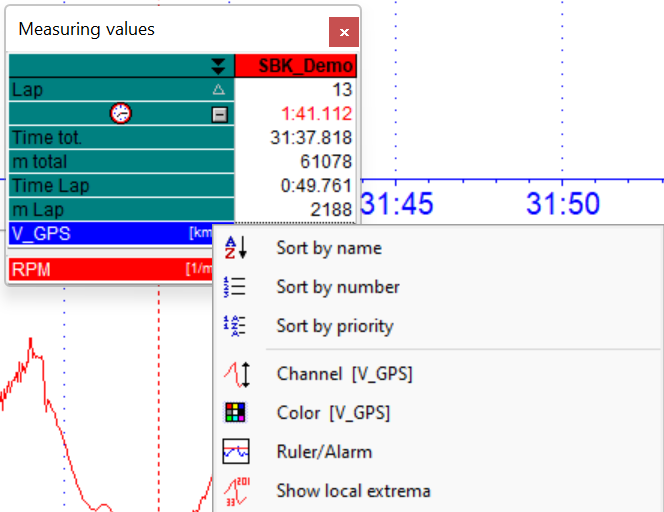
Channel settings via measured-values window
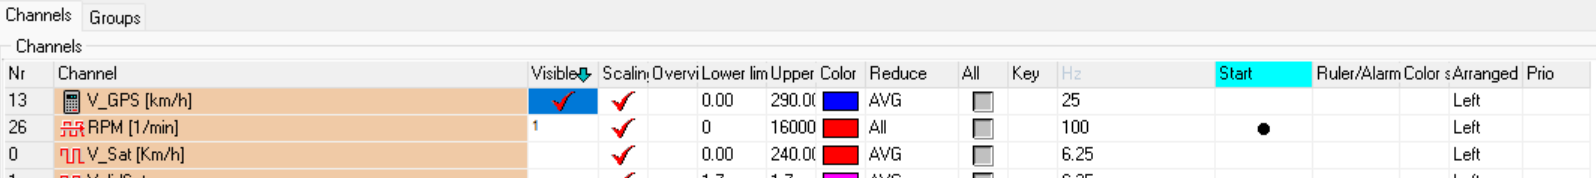
Activating channels for displaying
Moving window
For dispayling a channel in moving window, the box Visible must be checked in channel list.
Important
Small numbers in box Visible this channel is displayed in respective area. Channels can not added or deleted from areas via channels list but only via sub-menu (Areas)!
Overview window
When checking box Overview the respective channel is displayed in overview window.
Grouping channels
Instead of activating channels one by one for displaying in moving window, channels can be added to groups.
Important
By activating a group for displaying in moving window all channels of the group are added to moving window.
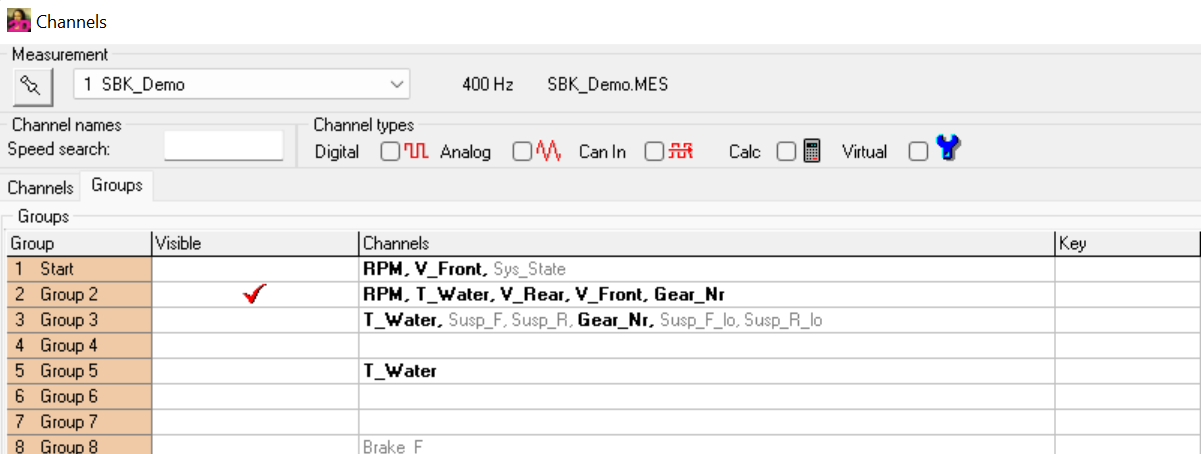
Grouping channels
Channel properties
All other channel properties are set via the following channel window which opens when clicking on channel limits in channel list.
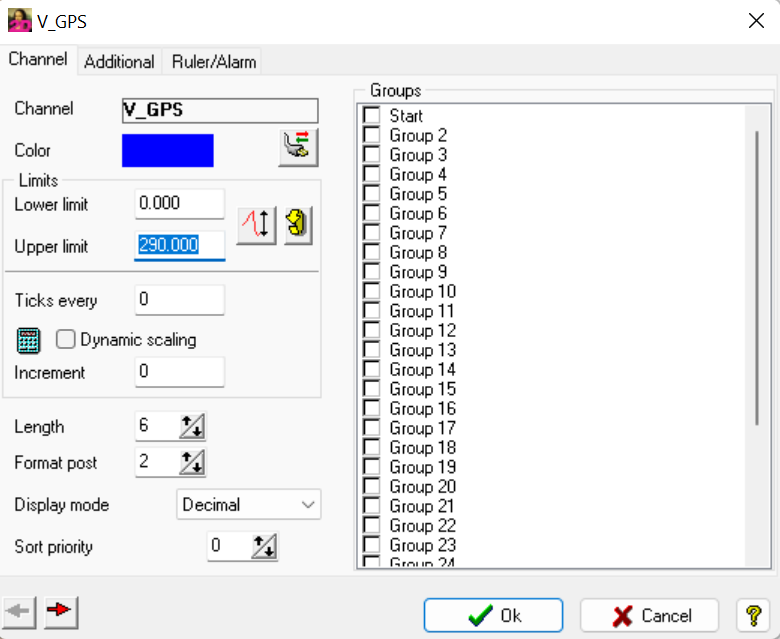
Channel properties
Color
By clicking on color box, the color of the respective channel can be set.
Limits
It is either possible to set channel limits manually by entering values or via AutoScale-button next to manual limits.
Important
AutoScale button sets limits of channel to maximum and minimum values in current measurement.
When activating Dynamic scaling the software automatically scales the channel to maximum and minimum value of current selection of moving window.
Type and format post
With options Lenght, Format post and Display mode it can be chosen how the channel value is displayed in measured-values window.
Ruler/Alarm
Rulers and alarm can be used to display auxiliary lines in moving window at different values of the channel.
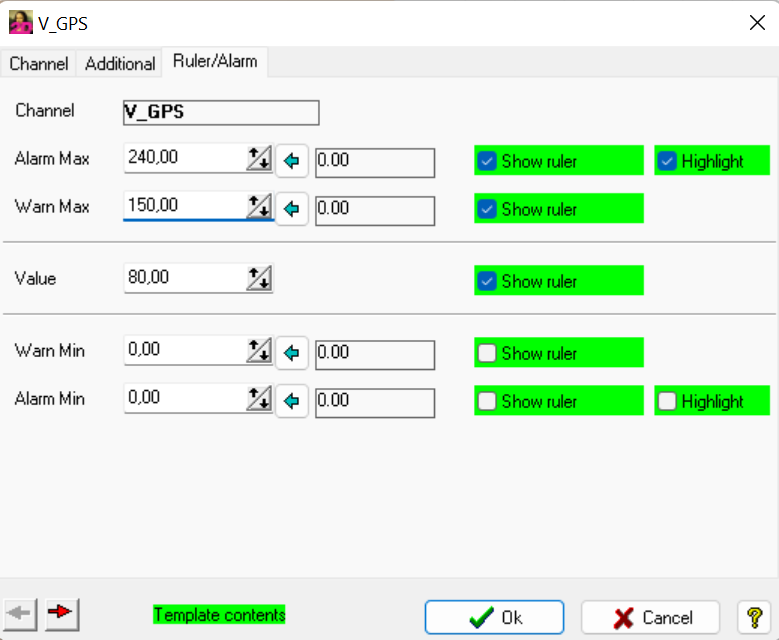
Ruler and Alarm setting
Ruler and Alarm example
Reduce/All
For each channel, different display options can be selected in the Channel list for both the moving window (All) and the overview window (Reduce).
The reason for this is that only a certain number of pixels is available on a PC screen.
Attention
Whether all pixels of a channel are drawn or not depends on the information the channel contains. High frequency channels like IMU accerlation axes usually cover many other channels in the moving window in All mode. Bit channels, which may only have the value 1 for one sample, are not displayed without All mode in the Moving window when scrolling.
The default setting All mode OFF for all channels can be seen in the fact that when high-frequency or bit channels are displayed, channel values are often no longer displayed or are displayed differently when scrolling through the measurement.
Attention
These settings ONLY affect the display of the channels in the Moving or Overview window and NOT the calculations. All channel values are always available for the calculations.
Moving window (All checkbox)
This checkbox can be used to select for each channel whether all existing pixels are to be drawn or not.
Overview window (Reduce field)
This selection window can be used to decide whether only the Minimas, Maximas, Average or all pixels of the channel are to be drawn with priority.
Measurement Mode
To enter measurement mode, do a double click or press <space>, <ESC> or double-click to end.
When being in measurement mode the physical values corresponding to the current position of the mouse pointer are shown in a separate small measured-values window.
Press the <space> or double-click to start measurement mode, <space>, <ESC> or double-click to end.
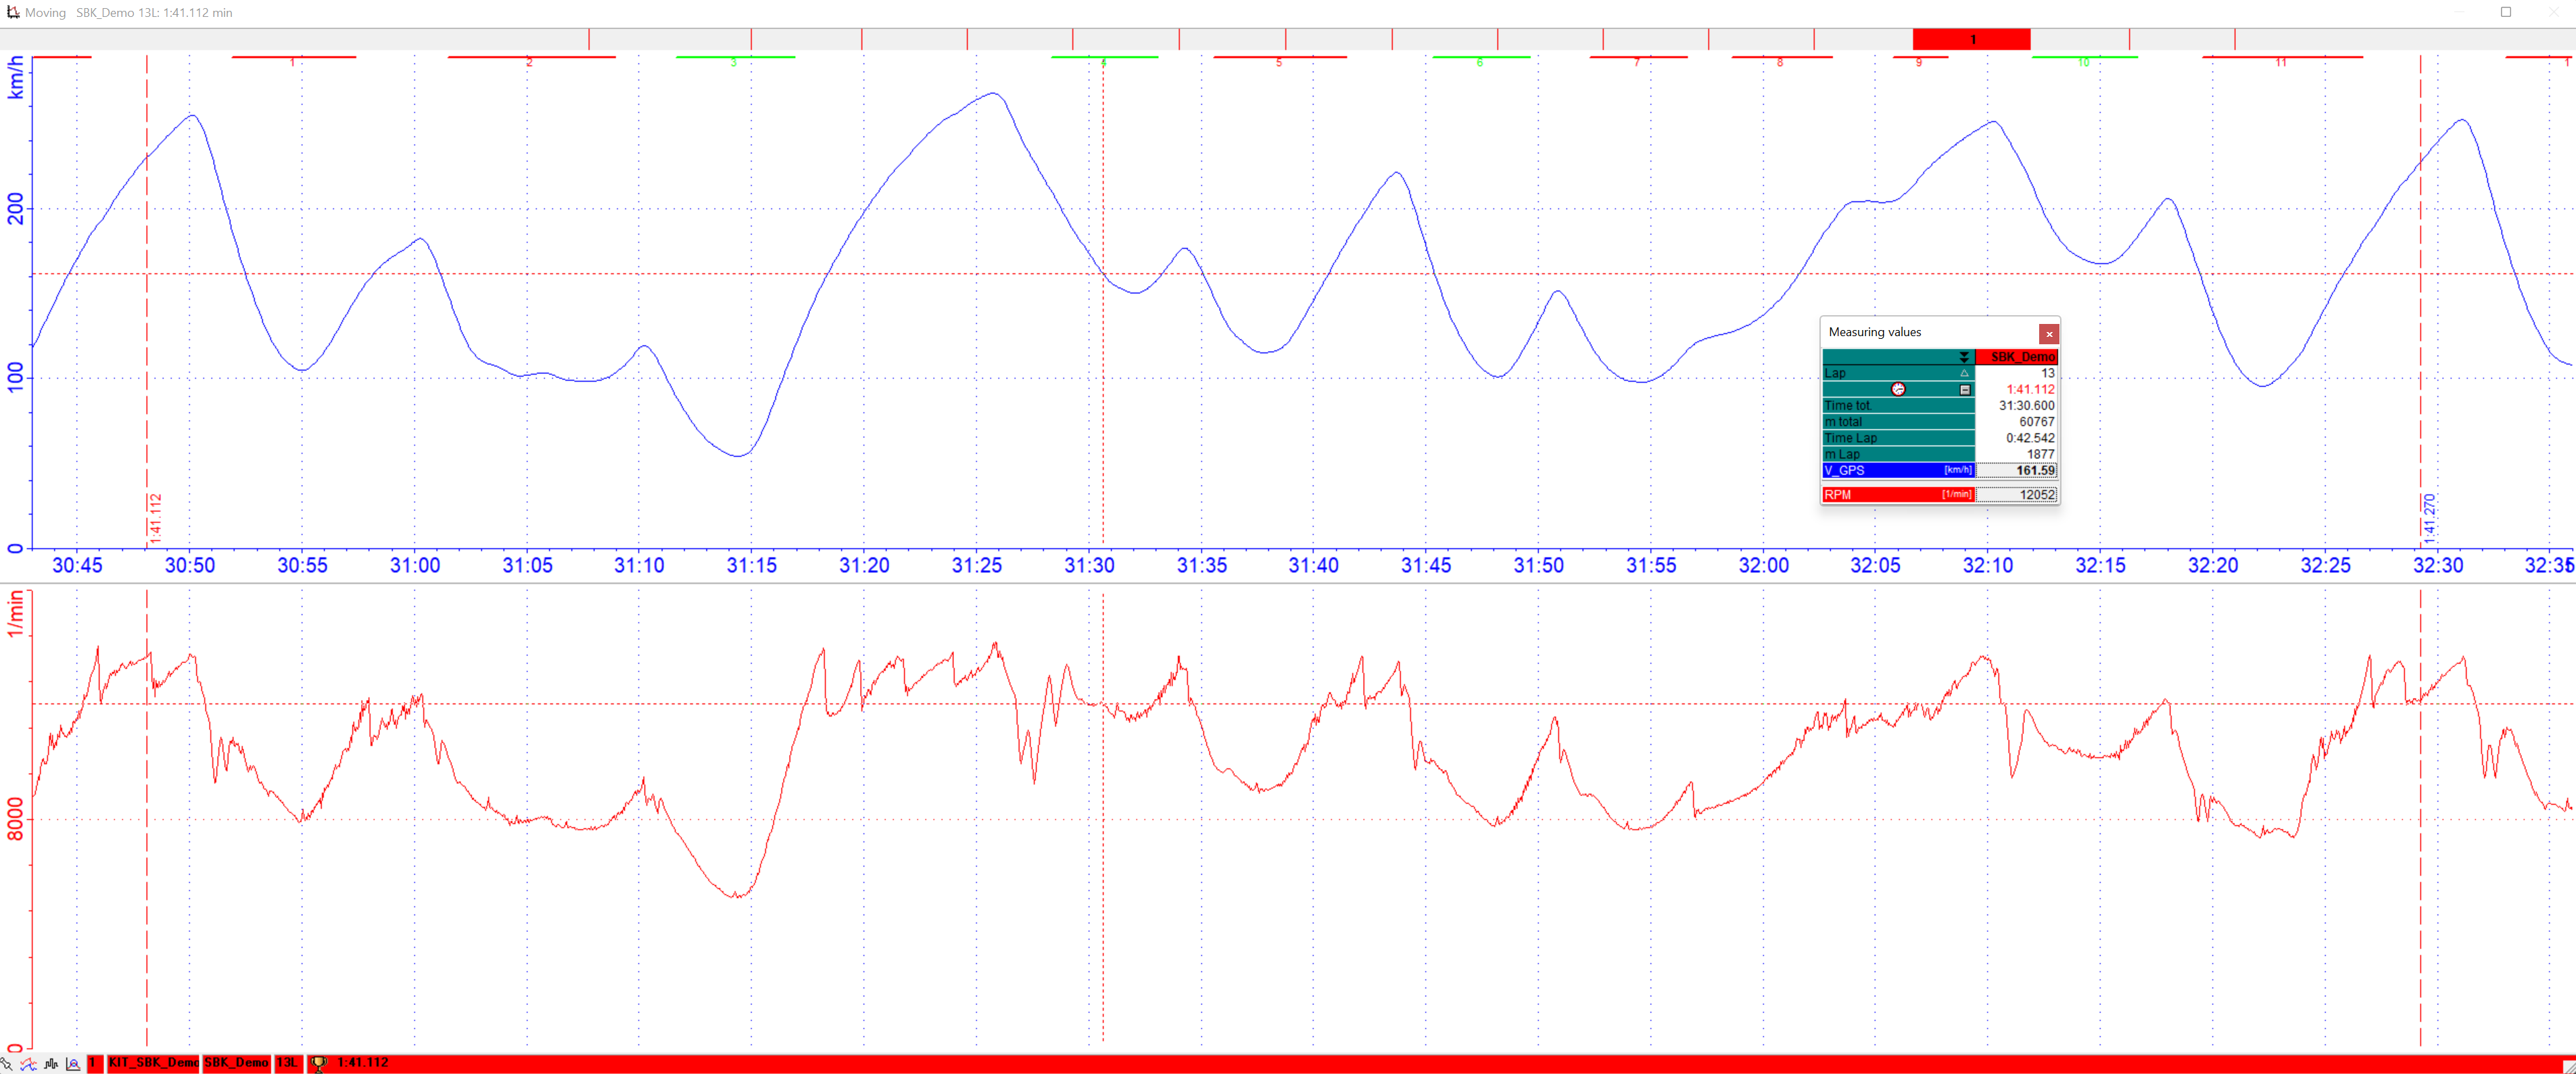
Enabled measurement mode
Important
You can use all the Analyzer functions in measurement mode. For example, you can resize of the section, load a different measurement, or remove a measurement.
Important
The measured-values window shows the measured physical values for a channel that correspond to the current position of the mouse pointer.
This measured-values window shows either the measured values of all visible (activated) channels or all available channels.
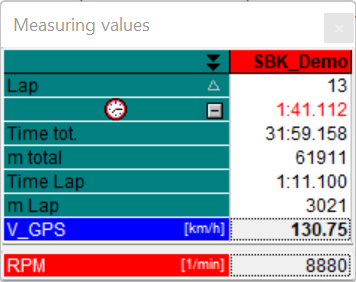
Measured-values window with only activated channels
Important
Toggling between the two modes is possible by clicking on the small black double arrow of measured-values window. This double arrow can be found in the header of the left column of the measured-values window.
In measured-values window, the channel can be disabled in moving window by double-clicking on a channel.
Holding left mouse key on a measured value (not on the channel name) in the measured-values window, the corresponding channel starts flashing in the Moving window.
Important
This makes it easier to identify the channel, particularly if you have loaded a number of measurements and have numerous channels visible for each.
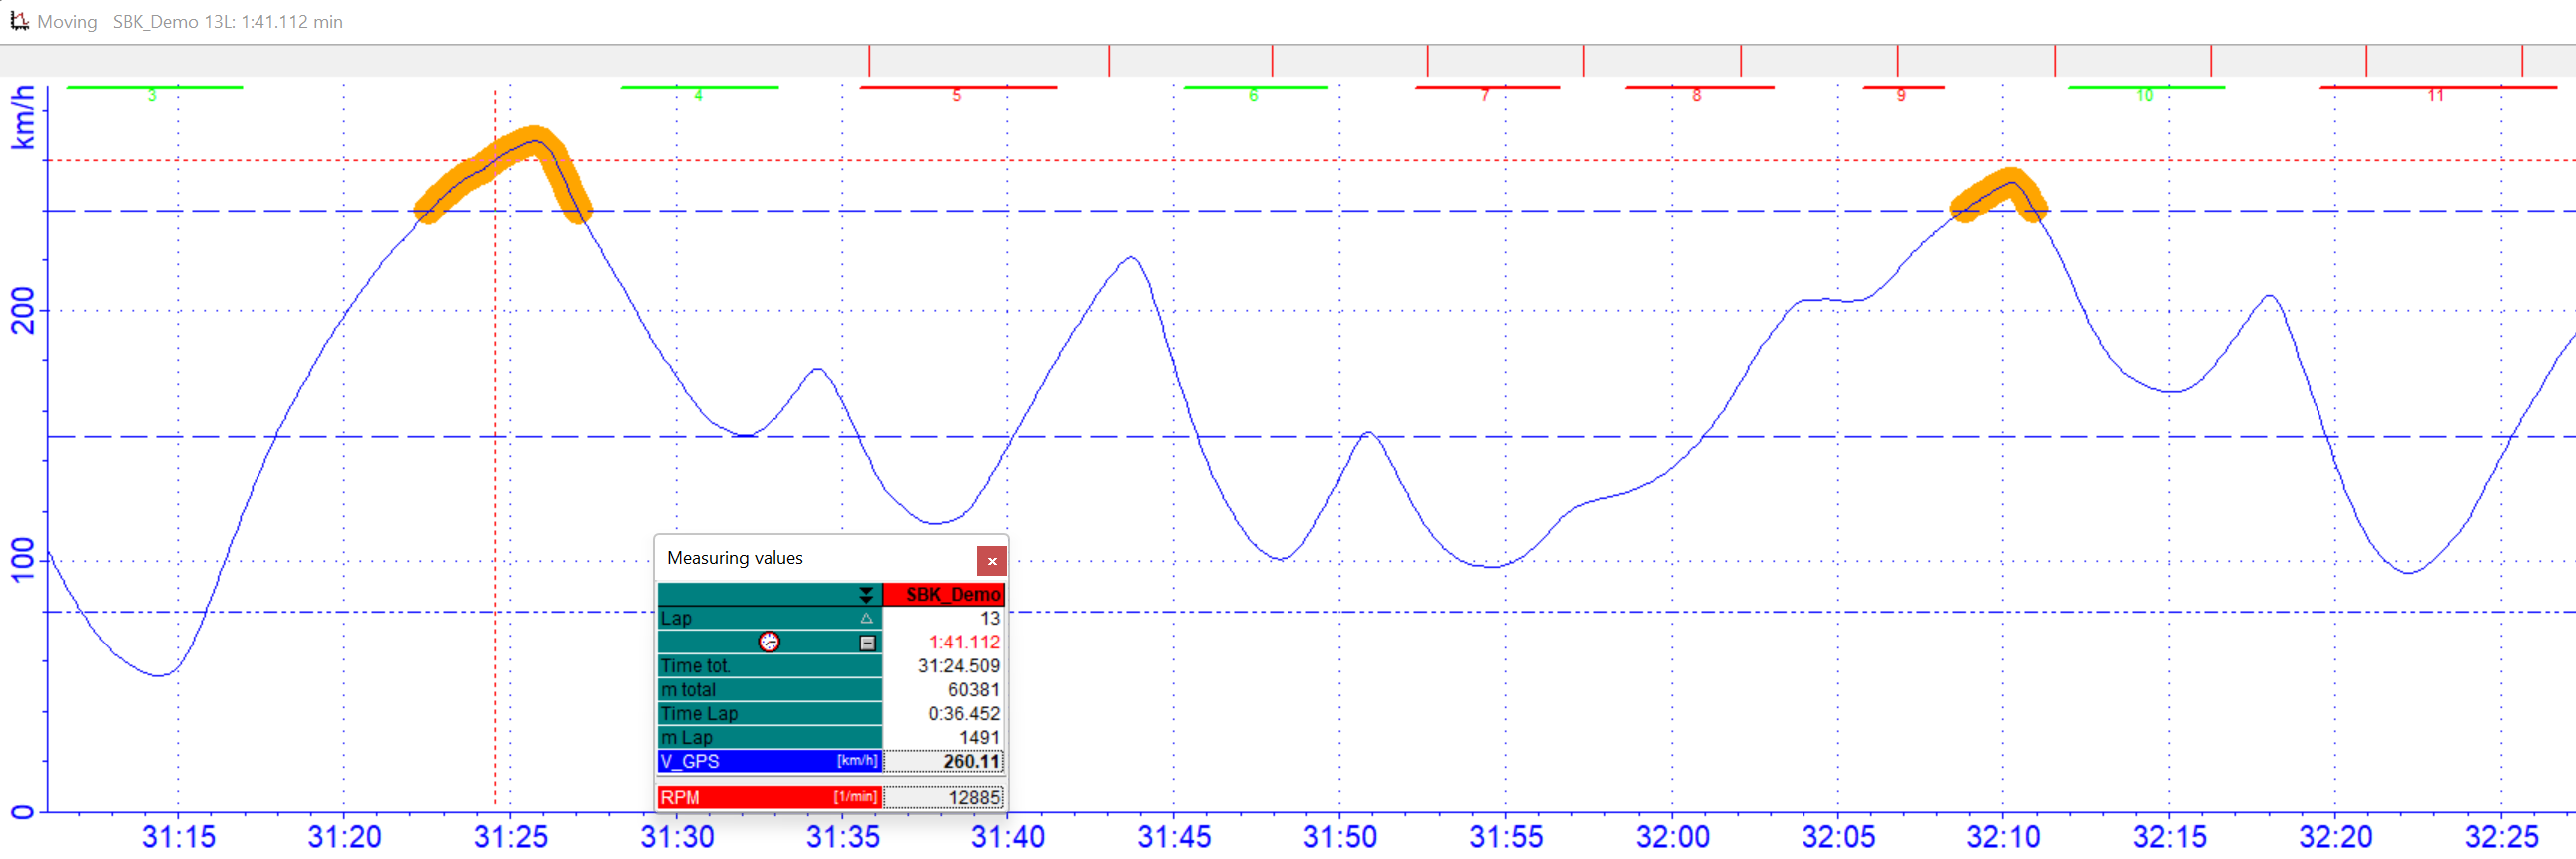
Marker
When doing left mouse click in moving window with activated measurement mode, a marker can be set.
By again doing a left mouse click in moving window, a second marker can be set.
Attention
To remove markers press <ESC> to leave measurement mode.
Quick MES mode
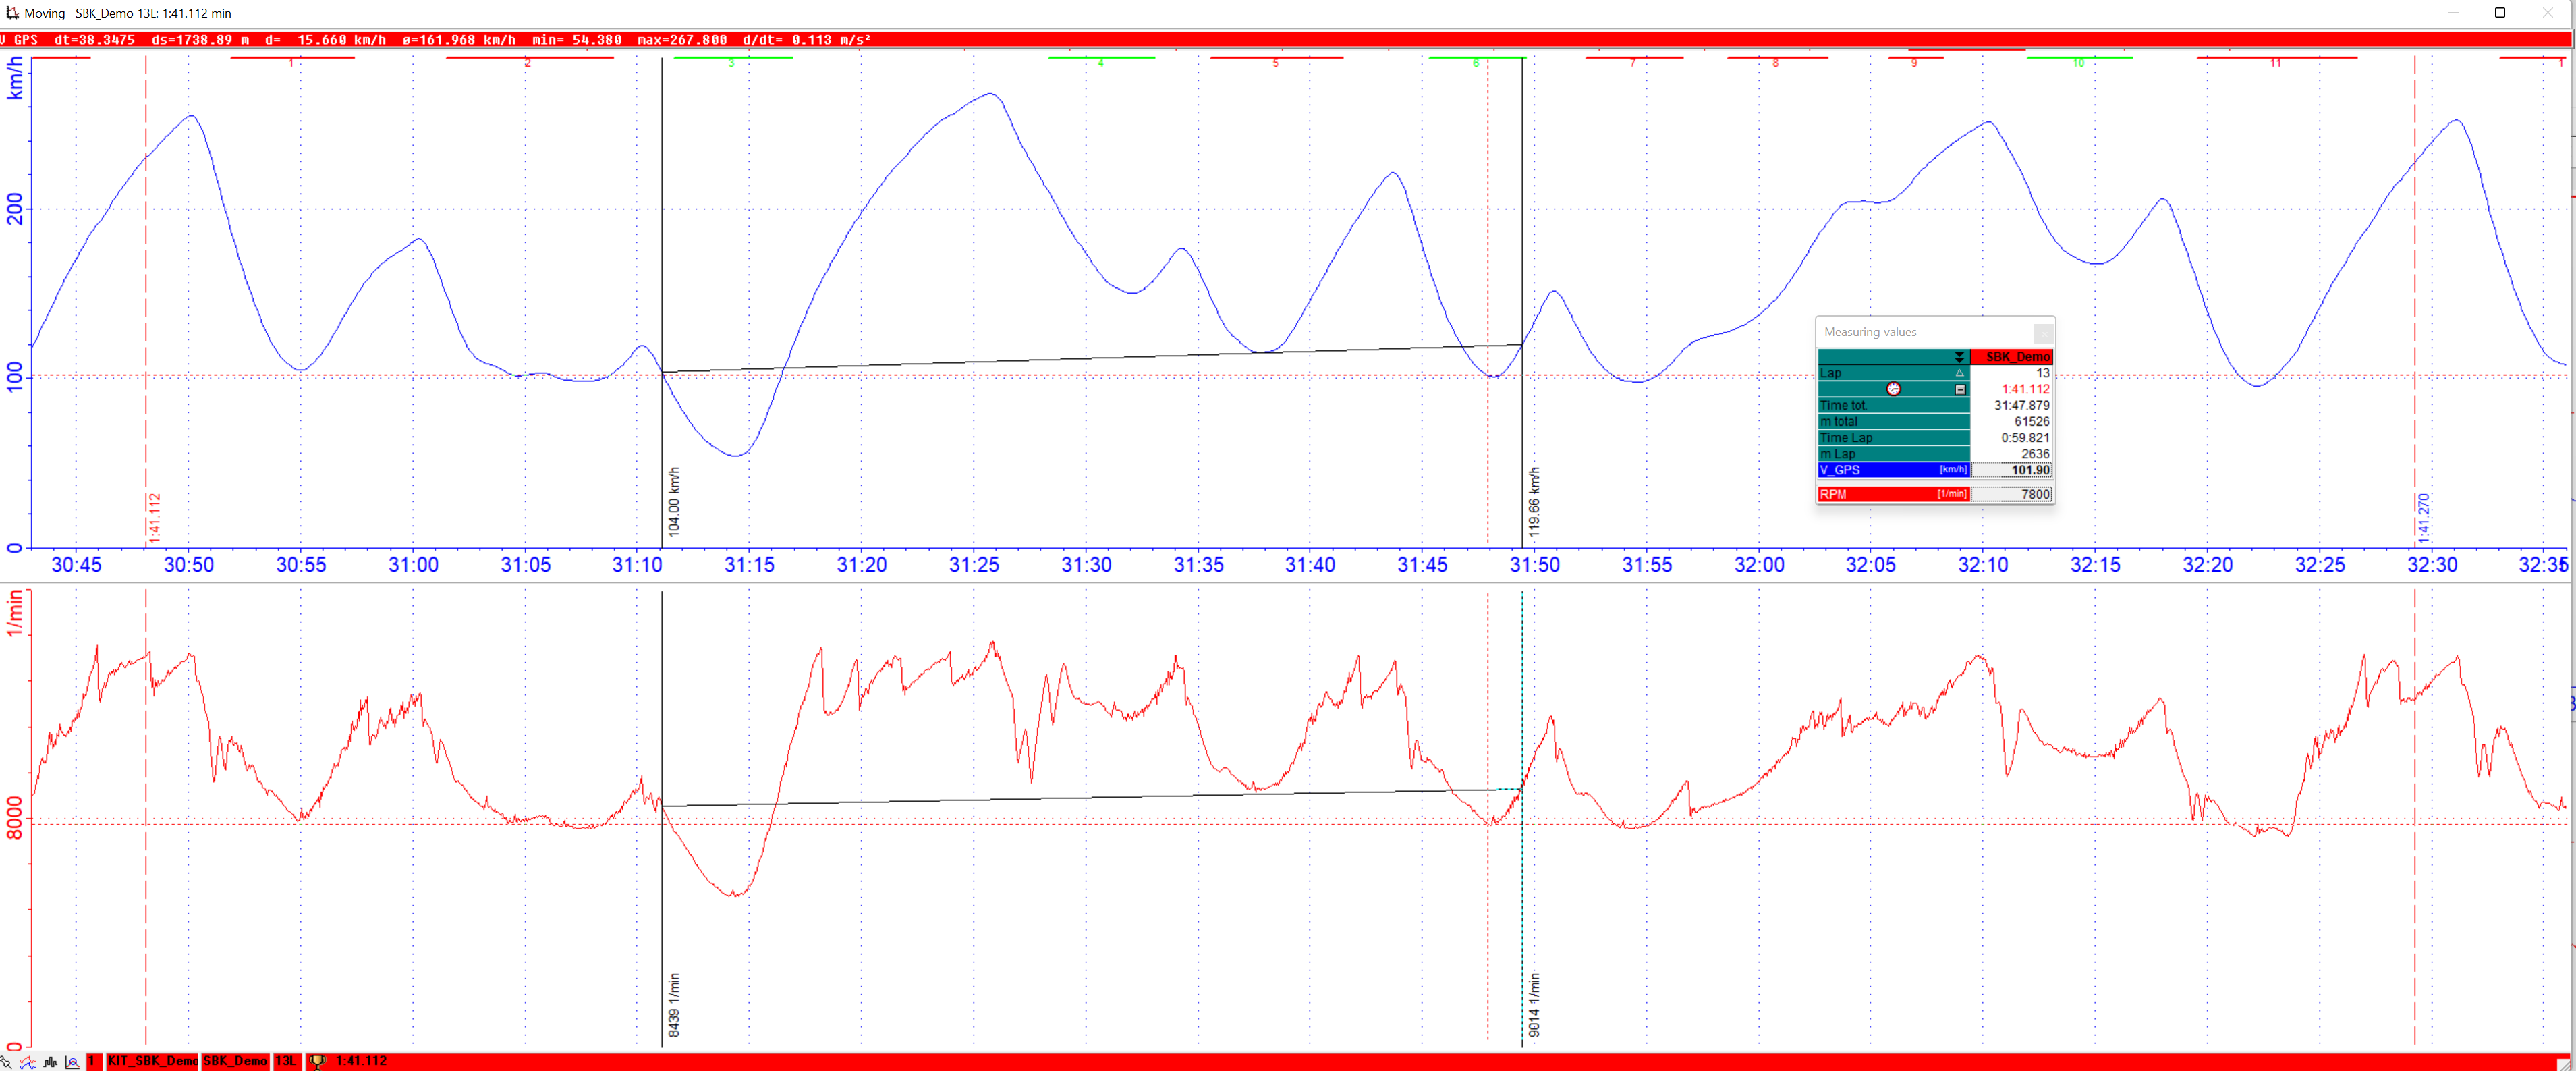
When two markers are set in moving window, at top bar of moving window the software shows some quick measurement values from between the markers of currently in measured-values window selected channel.
Measured-values window with only activated channels

Detailed screenshot of Quick MES mode of channel #V_GPS
dt: Time between set markers
ds: Distance between set markers
d: Difference between channel value from second to first marker of selected channel
avg: Average value of selected channel between set markers
min & max: Minimum and maximum value of selected channel between set markers
d/dt: Derivative of selected channel between set markers
Attention
Quick MES mode is only possible for channel in moving window and not for channels in areas!