Laptiming
Description
At 2D modules, laptimes can be created in many ways, e.g. using GPS coordinates or TransponderX2 messages as lap trigger signals to display the lap time live at the track on 2D dashboards or in 2D Analyzer.
Addtional manual
More information about laptrigger in Analyzer can be found here!
Addtional manual
Respective manuals can be found at our website: www.2D-Datarecording.com/manuals/
Beside these two live functionalities it is also possible to create and analyse the laptimes in post-processing in Analyzer.
Even the GAP time function can be readjusted in the Analyzer in post-processing (see here).
Addtional manual
Respective Dashboard manual with information for GAP time functionality can be found at our website: www.2D-Datarecording.com/manuals/
Lap Time
When laptriggers are created in Analyzer via tab Functions the Laptime table can be opened.
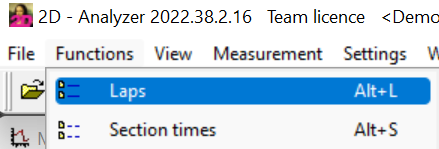
Open Laptime table via Analyzer tab Functions or pressing <ALT>+<L>
Addtional manual
More information about laptrigger in Analyzer can be found here!
At opened Laptime table the currently in Moving window selected lap is highlighted with blue background and at fastest lap the trophy icon is shown.
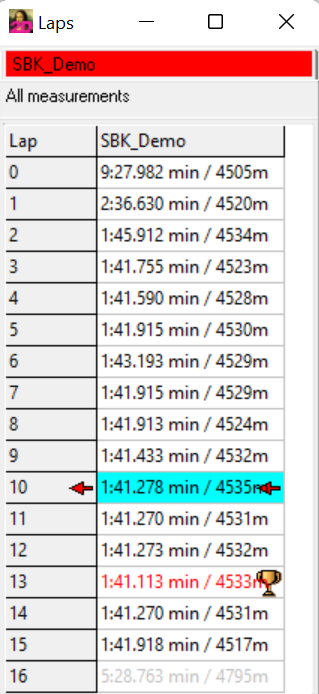
Laptime table
Create via GPS coordinates
Laptriggers can be created in multiple ways. In this section it is described how to create laptriggers by GPS coordinates.
Addtional manual
More information about laptrigger in Analyzer can be found here!
Make an installation lap to get an accurate GPS measurement of the circuit layout and open respective measurement in Analyzer.
Open measurement with GPS channels in Analyzer
Set marker by left click on desired finish line position
Open submenu by right click.
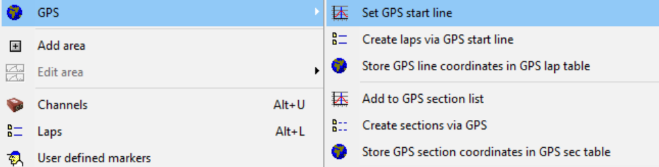
Set GPS start line via GPS line
By clicking on <Set GPS start line> the position of the marker can be saved as line file and also is set as new finish line when confirming the following message with <OK>.
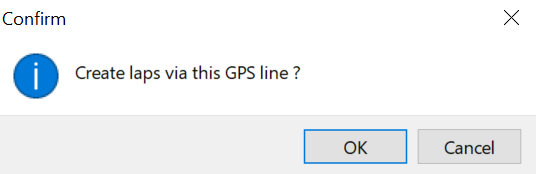
Create laps
Attention
If no laptriggers are created by clicking on <OK> please check the Timeout settings MinLapLength and MinLapTime in Race.ini in application data directory (WinARace shortcut <CTRL> + <ALT> + <D>)
Via Analyzer tab Functions (or shortcut <ALT> + <L>) the laptime overview can be opened
Section Time
When laptriggers are created in Analyzer via tab Functions the Section table can be opened.
Open Section time table via Analyzer tab Functions or pressing <ALT>+<S>
Attention
If no section triggers are already existing, the software ask to insert sections. The software always adds three default sections with same size by using lapmeters!
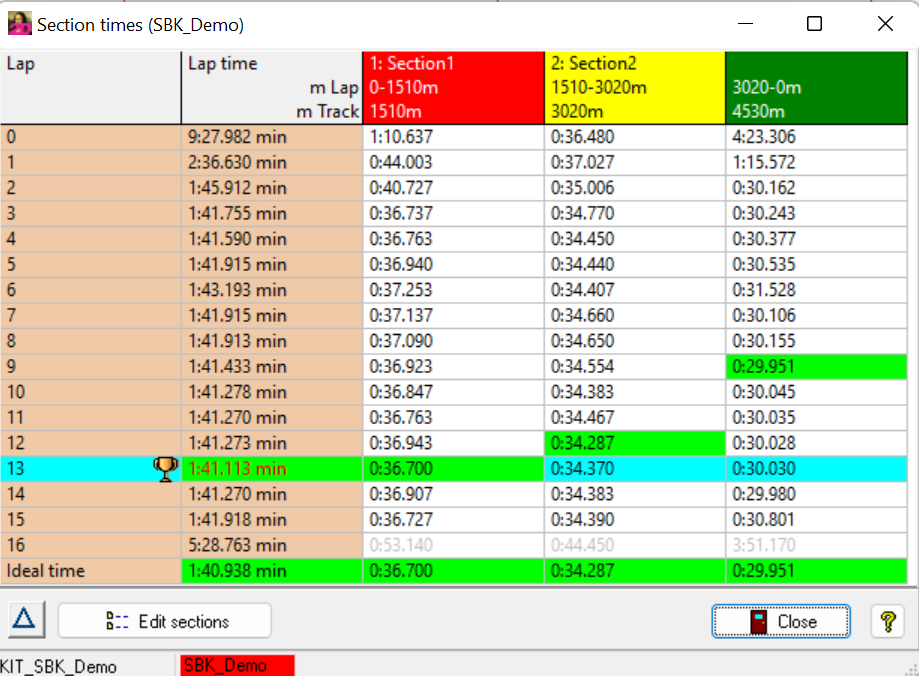
Section time table (best sections are highlighted in green)
Important
Via Delta button in lower left corner of the sectimes table, the dispayling can be switched to “delta-to-fastest-section”-mode.
Ideal time
The in section time table shown Ideal time is created by all best sections of the current measurement.
Create via Lapmeter
Attention
If no section triggers are already existing, the software ask to insert sections. The software always adds three default sections with same size by using lapmeters!
Section triggers can be created in multiple ways.
In this section it is described how to create section triggers by lapmeters.
Edit default entries
When section triggers are created by lapmeters, by right-clicking on sectimes table, the sections can be edited.
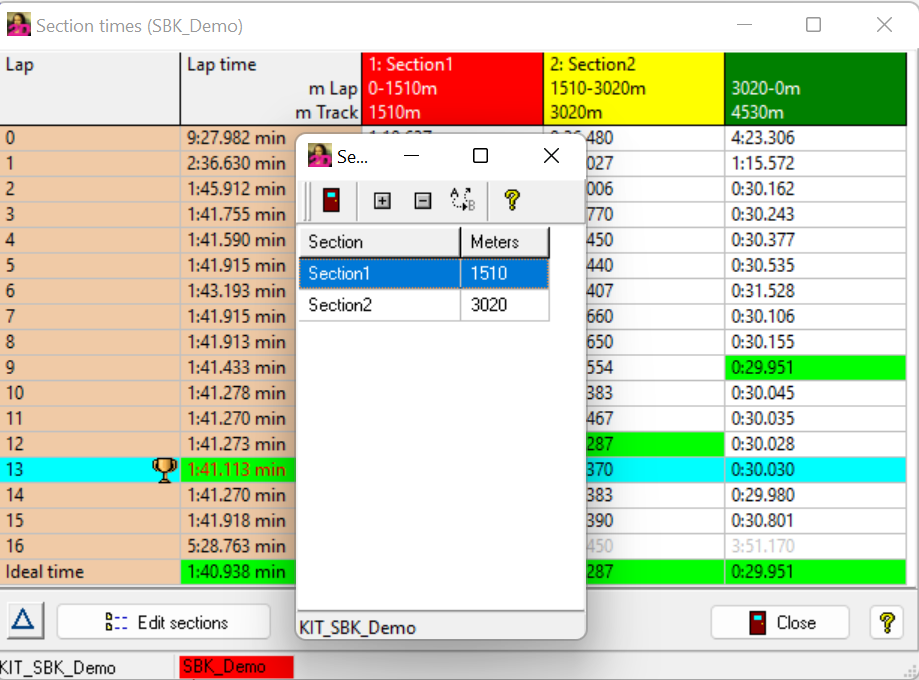
Edit section trigger created by laptmeters
Create new sections by lapmeter
Open measurement in Analyzer
Set marker by left click on desired section trigger position
Open submenu by right click and Add section
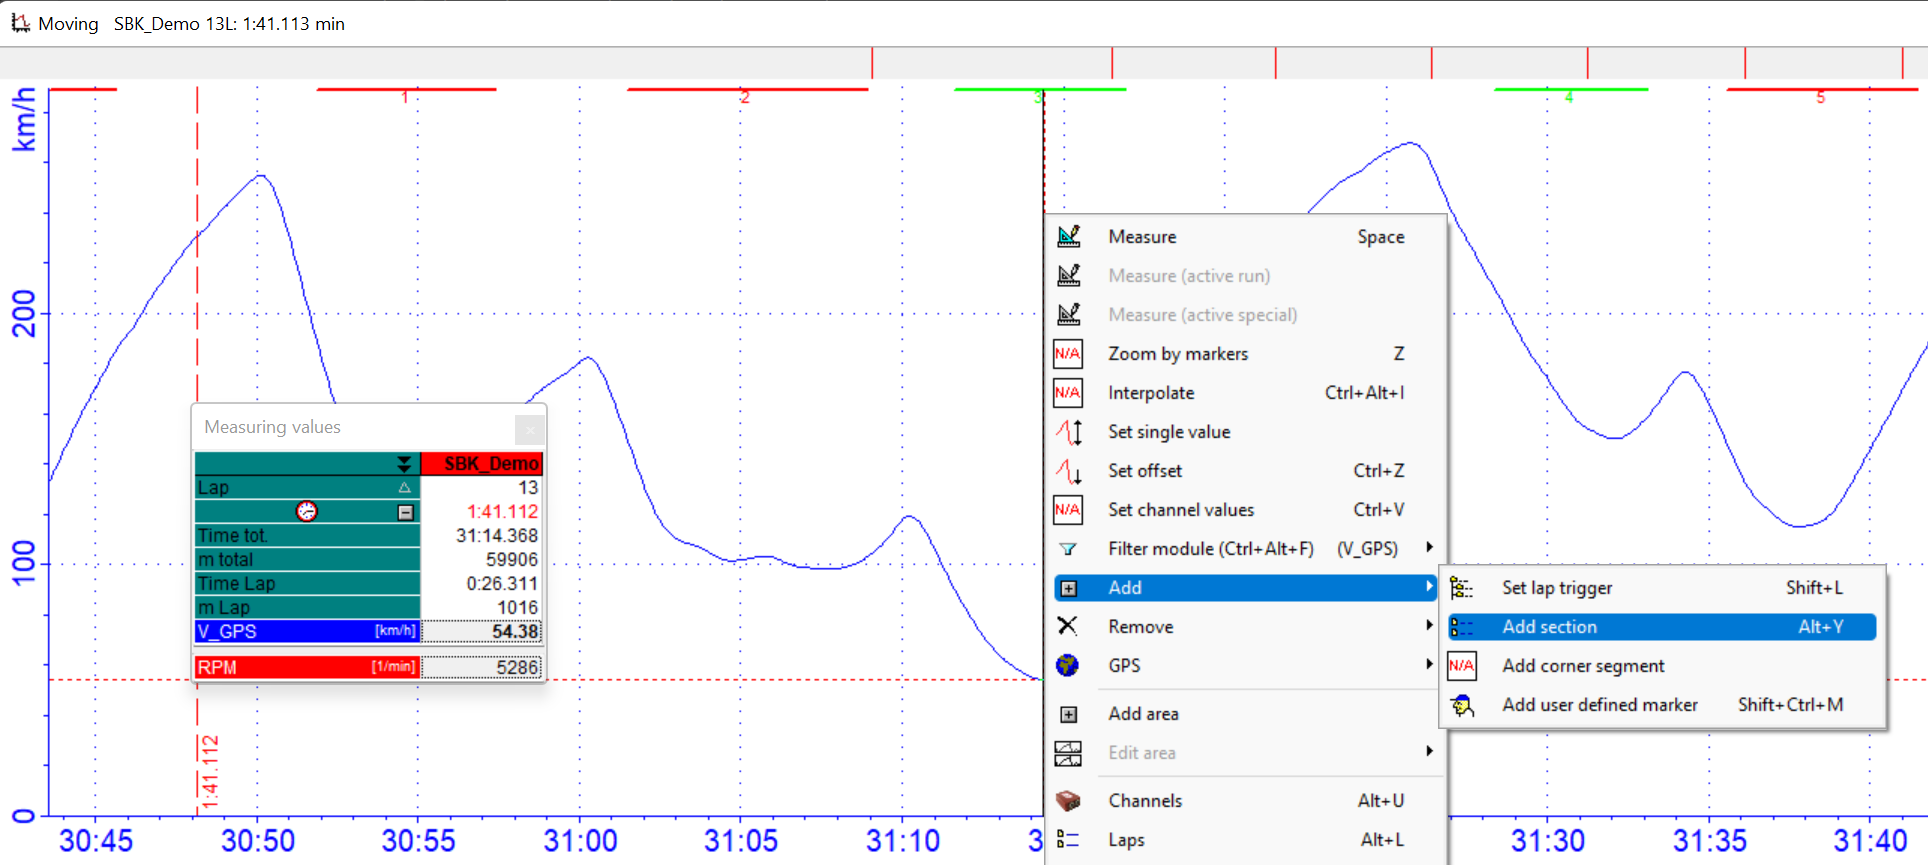
Edit section trigger via moving window sub-menu
Attention
If more section triggers should be added to list press Close and repeat step 2 & 3 for every desired section trigger again.
If all desired section triggers are added to list press on Create triggers in area Complete section list (user) to create GPS sections
Create via GPS coordinates
Section triggers can be created in multiple ways.
In this section it is described how to create section triggers by GPS coordinates.
Make an installation lap to get an accurate GPS measurement of the circuit layout and open respective measurement in Analyzer
Open measurement with GPS channels in Analyzer
Set marker by left click on desired section trigger position
Open submenu by right click
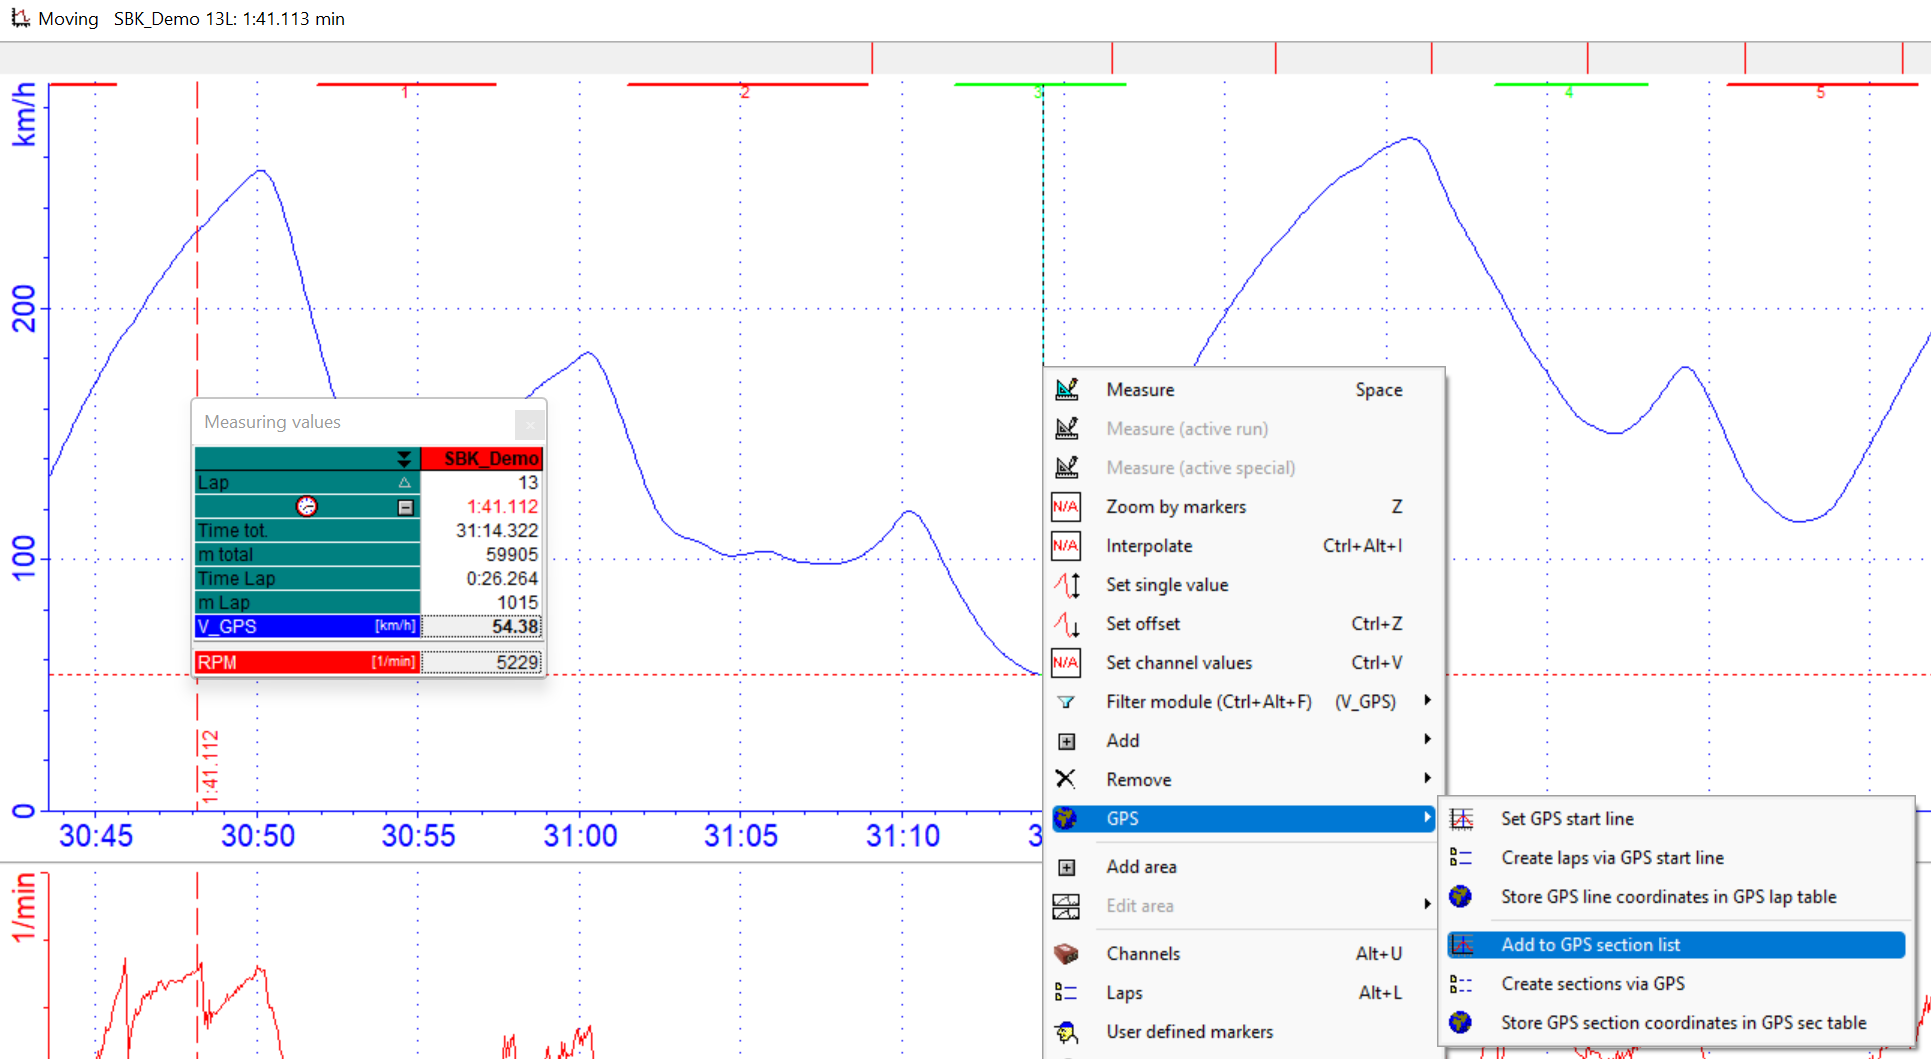
Set GPS section trigger
By clicking on Add to GPS section list the position of the marker can be added as section trigger with definable name to section list.
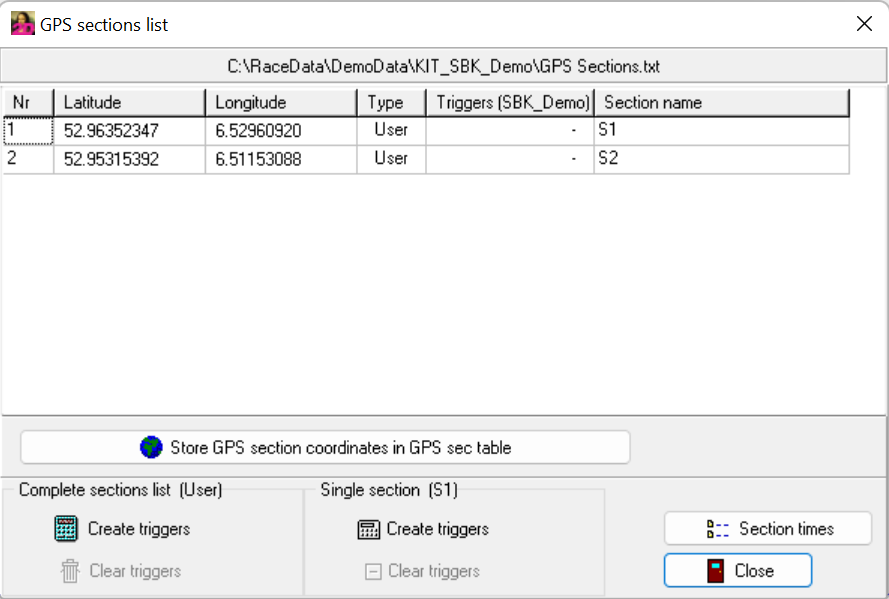
Section list
Attention
If more section triggers should be added to list press Close and repeat step 3 - 5 for every desired section trigger again.
If all desired section triggers are added to list press on Create triggers in area Complete section list (user) to create GPS sections
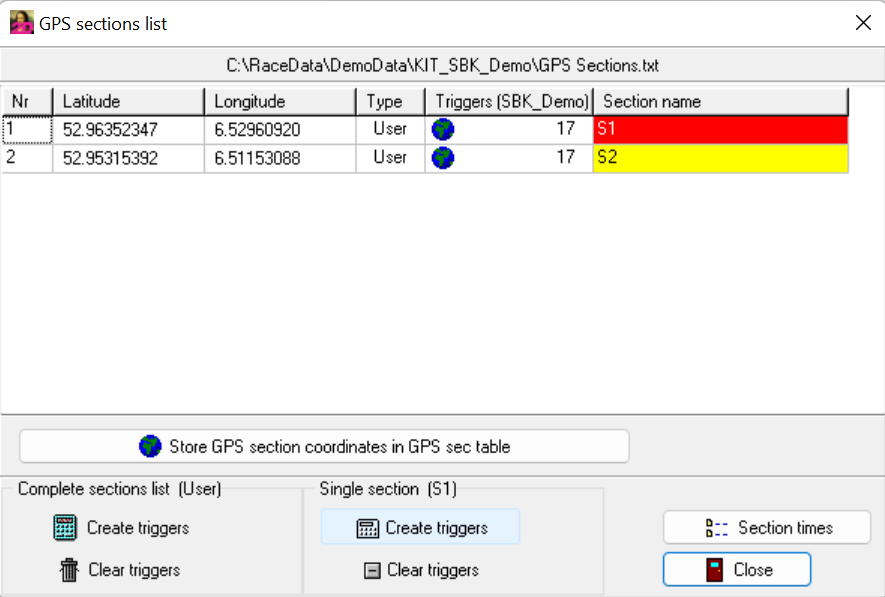
Create section triggers
To open Section time table press on button Seciton times
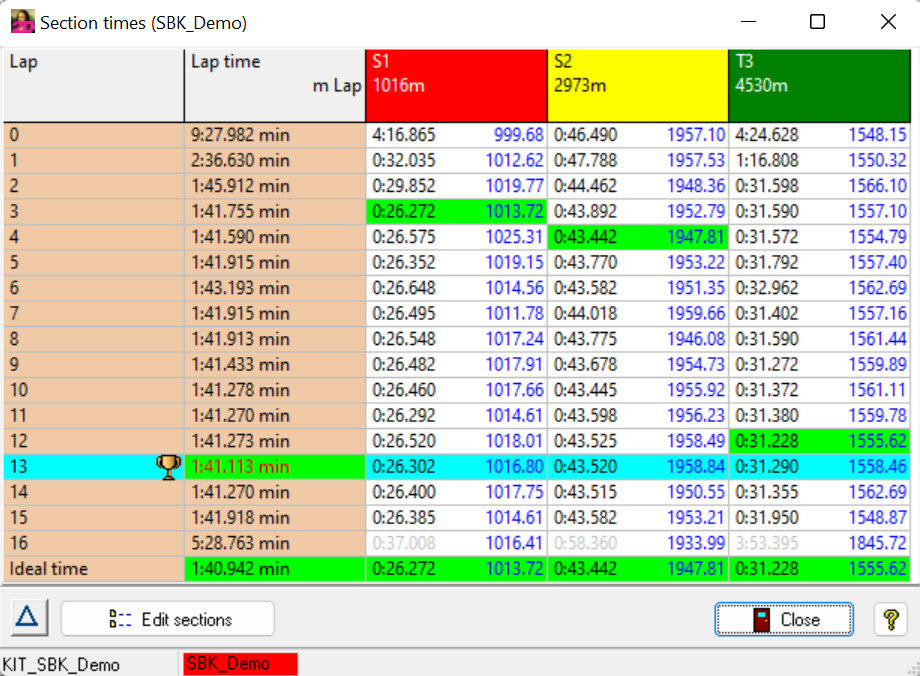
Section time table created by GPS coordinates
Attention
Created section triggers are now available for all measurements of current event!
Further laptiming possibilities
Post-processing Time/Distance channels
Important
A measurement of the BMW M1000RR in Hockenheim was used as an example
Preparation
Open REFERENCE measurement in Analyzer
Navigate to reference lap (e.g. fastest lap) and adjust zoom and view that only reference lap is shown in moving window
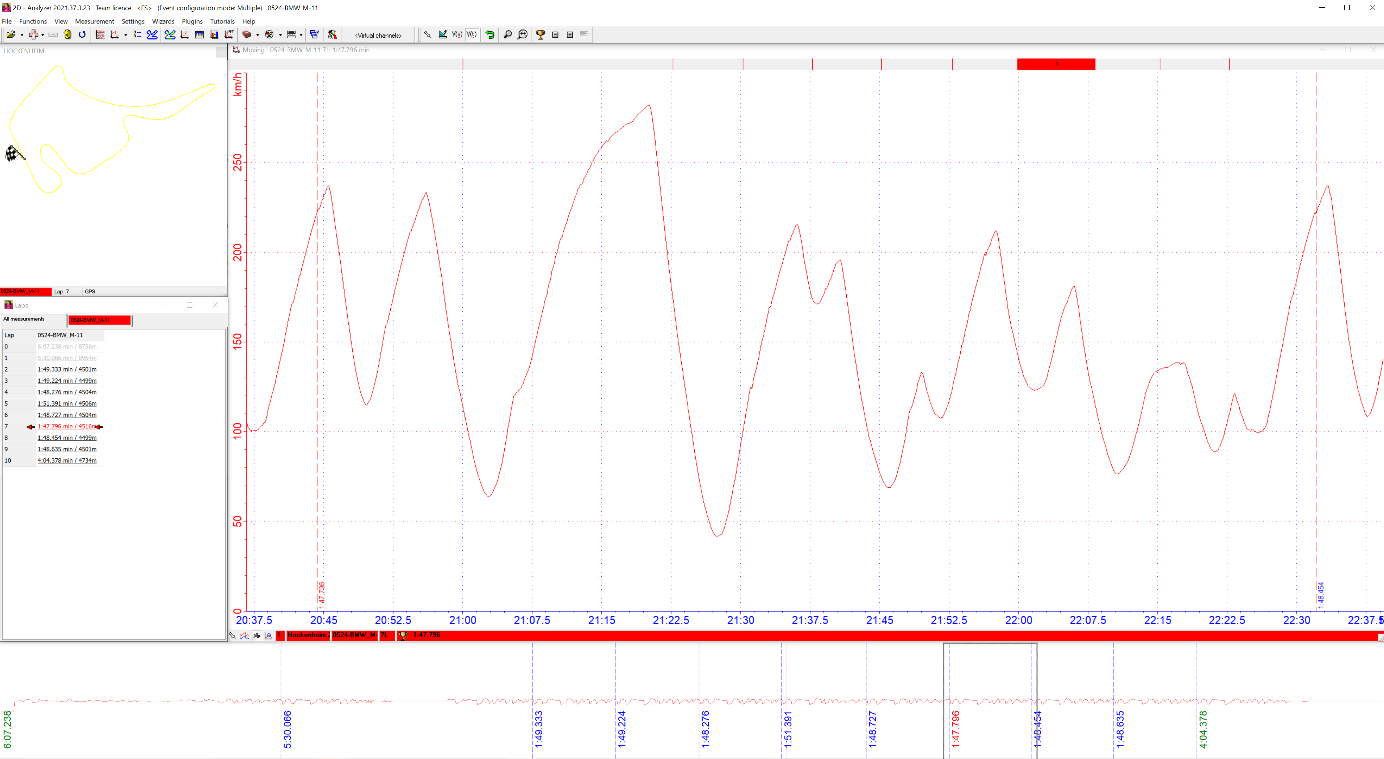
Fastest lap in reference measurement
Important
The shown dropdown menu can be used to navigate to fastest lap!
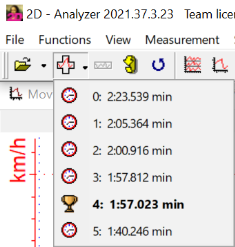
Navigate to fastest lap via dropdown menu
Load comparison lap of same measurement (e.g. via dropdown menu) or lap from other measurement
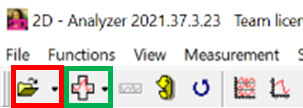
Load lap icons
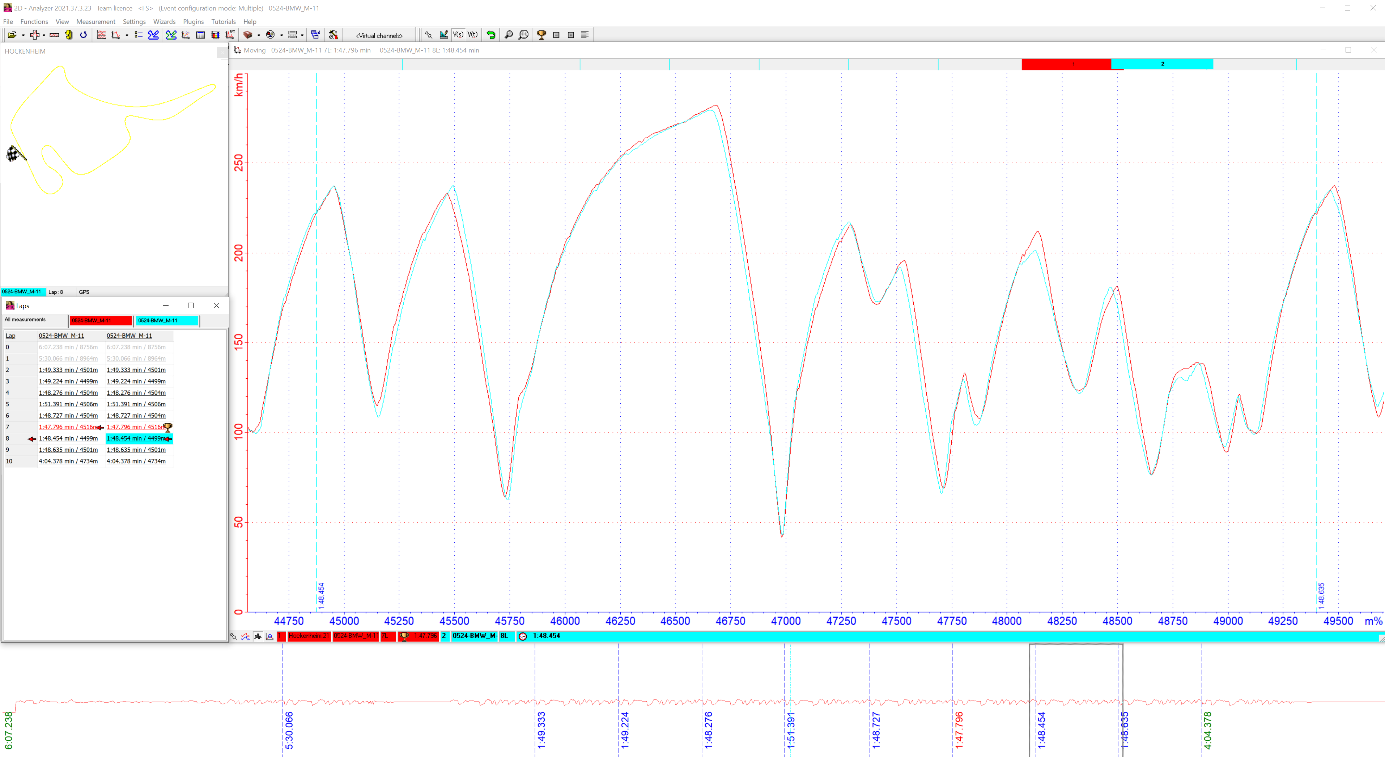
Switch x-axis unit from time [V(t)] to distance [V(s)]

Switch from time to distance distance plot
Important
When comparing laps, it is better to use the distance as x-axis, as the lapmeters do not vary as much even with different lap times.
Align measurements that both start triggers are overlapping
Important
By using <page-up> and <page-down> keys it can be jumped between the same positions of different laps in measurment!
When reference and comparison lap are aligned, link the two measurements by pressing the marked button or key <v>

Link shown measurements
Activating channels
Open the channel list by pressing the marked button or using shortcut <ALT> + <u>

Open channel list
Select filter for virtual channels

Select virtual channels in channel list
Important
For all channels different colors and scalings can be freely chosen!
Channels |
Unit |
Description |
|---|---|---|
Time diff |
[sec] |
Time difference between reference and comparison lap between laptriggers
|
Tdiff window |
[sec] |
Time difference between reference and comparison lap only in visible part of moving window
|
Win change |
[sec/sec] |
Derivation of channel Time diff for better visualization of the places where time is gained and lost. |
Meter diff |
[m] |
Distance difference between reference and comparison lap between laptriggers |
MDiff window |
[m] |
Distance difference between reference and comparison lap only in visible part of moving window |
Important
If Win Change is switched on, always Time diff also is activated!
Examples
Time diff
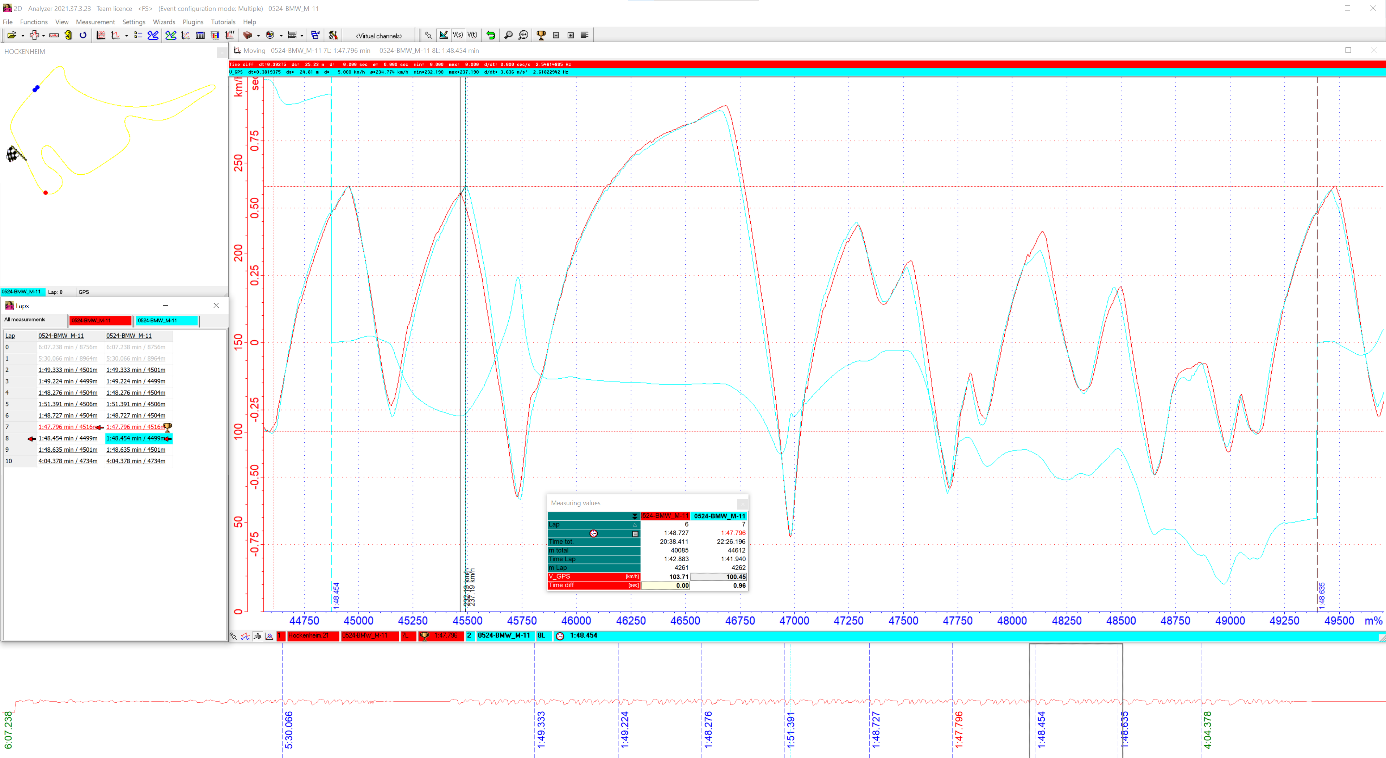
Channel Time diff in measurement overlay
As a result of braking 25 m later in comparison lap, the rider effectively wins 0.51 sec time in compared to reference lap (Time diff from -0.27 +0.24) at acceleration, but because of the higher velocity at the straight, the rider misses the brake point, and loses time again. The gap of about 0.16 seconds hardly changes during Parabolika.
At the end of the comparison lap the rider has lost in total 0.66 sec (Time diff -0.66 sec) seconds compared to reference lap.
Win change
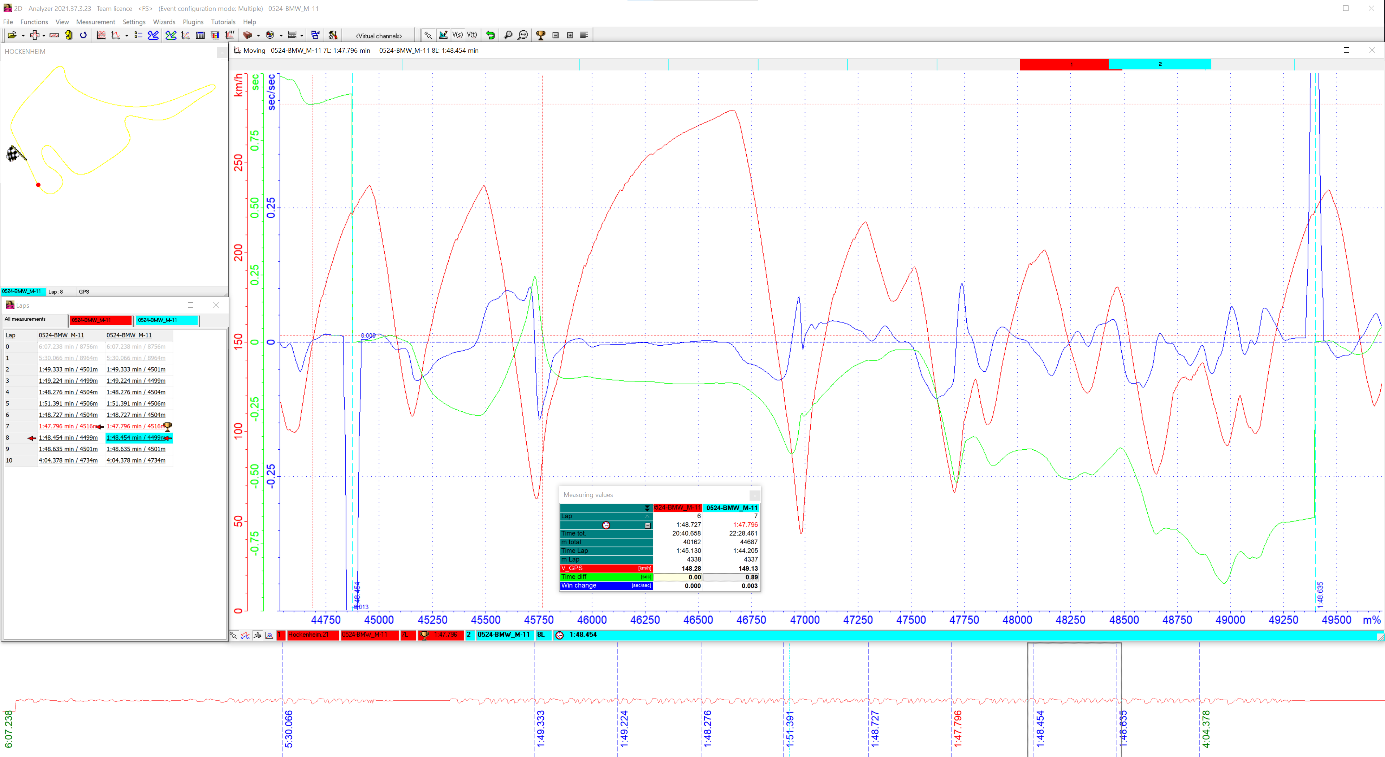
Channels Time diff & Win change in measurement overlay
The time gain because of later braking in comparison lap described above can be better read from the channel Win change, because if this is in the positive value, there is a time gain because of better acceleration phase. Also missing the brake point at the end of the straight becomes obvious due to the rapid change to a negative value of Win change.
TDiff Window
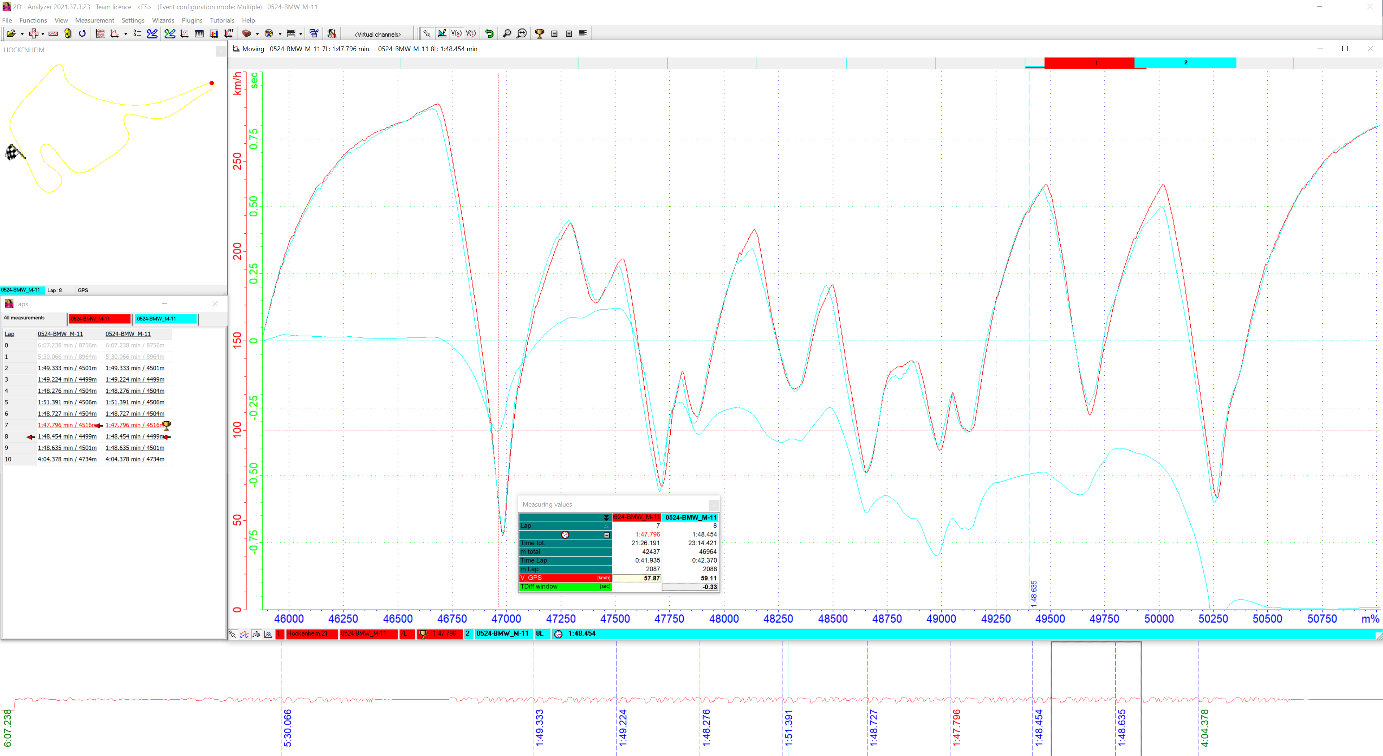
Channel TDiff window in measurement overlay
In order to anlyse only desired sections of a lap the TDiff window channel is used and the position of the moving window is changed, e.g. that Parabolika is at the beginning of moving window, as this channel always calculates the time difference from the current position of the moving window.
This very quickly reveals significant positions where the driver loses or wins time in different sections of the comparison lap.
Analyzer Settings
Via Analyzer options, which can be opened by pressing <F9>, it can be set, that when a second measurement is loaded, that channels Time diff and TDiff window are activated automatically and distance plot is activated.
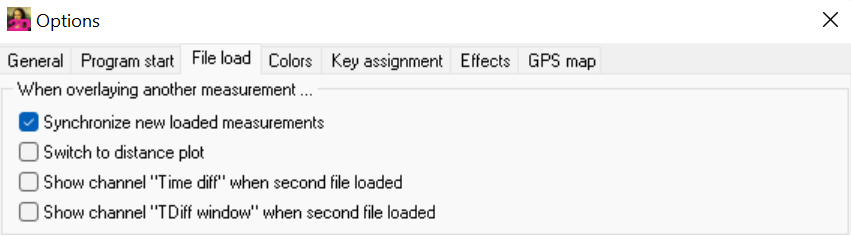
Analyzer options
FAQ
Time diff channel cannot be activated in Analyzer for displaying
In Analyzer open tab Settings Track Track settings and check box Event measured on closed track