2D Datarecording Documentation
General:
Download, Installation & Licence
2D software update
Projects
Trainings/Service
Software:
WinARace
WinIt
Analyzer
General software description
First steps
Phases
CalcTool
CalcTool Toolchains
Special channels
Export
Scripting
Plots and tools
SpecSheet
User Management
Tracksettings
Laptiming
Marker
Video Synchronization
Dashware
Merger and Appender
License Levels of the 2D Software
CalcTool
2D Datarecording Documentation
Analyzer
View page source
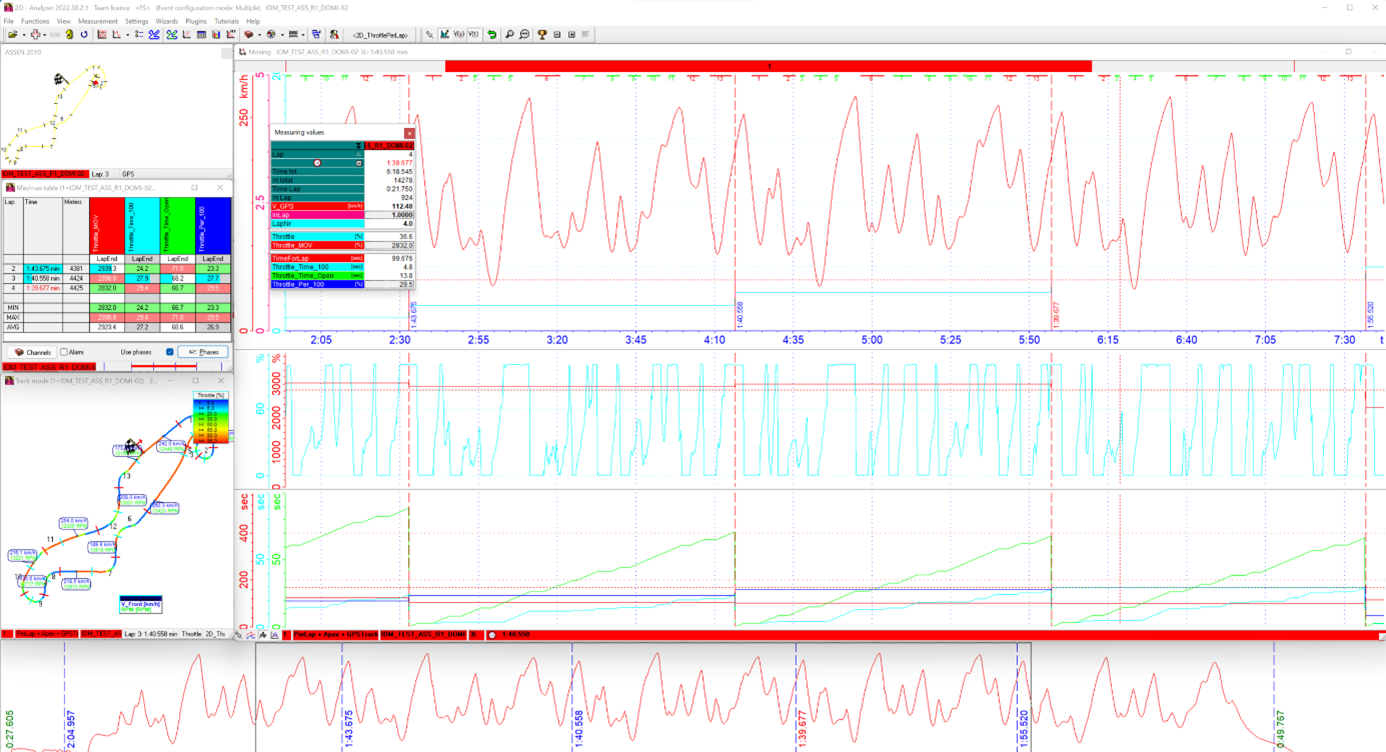
Analyzer
Screenshot 2D Analyzer
General software description
First steps
Phases
CalcTool
CalcTool Toolchains
Special channels
Export
Scripting
Plots and tools
SpecSheet
User Management
Tracksettings
Laptiming
Marker
Video Synchronization
Dashware
Merger and Appender
License Levels of the 2D Software