Plots and tools
2D Analyzer offers various possibilities to visualize measurement data.
All plots can be prepared and used later to compare data of multiple measurements loaded in Analyzer.
Important
All plots and tool windows positions are saved in Templates!
Important
As inputs for plots and tool, also Special Channels can be selected!
When creating new plots at higher license levels with activated User Management !!!Link!!! Plots can be created either only for current User or for all Users of Race installation.
Addtional manual
For all plots Phases can be used to organise/filter the currently displayed values of a plot, for e.g., removing in- and out-lap from Min-/Max-table. A preview of current phase selection is shown at bottom bar of plots.
Multi-Circuit (Google Maps overview)
GPS/GNSS positions from measurement are drawn on Google Maps background image.
Important
Only for laps currently shown in moving window lines are drawn in Multi-Circuit.
Multi-Circuit can be opened via Analyzer-tab Functions, by pressing <m> or using Header window icon.
Attention
For loading Google Maps background image valid internet connection is required!
Attention
For correct drawing of driving line, the Special Channels GPS_Latitude, GPS_Longitude and GPSValid must be set correctly!
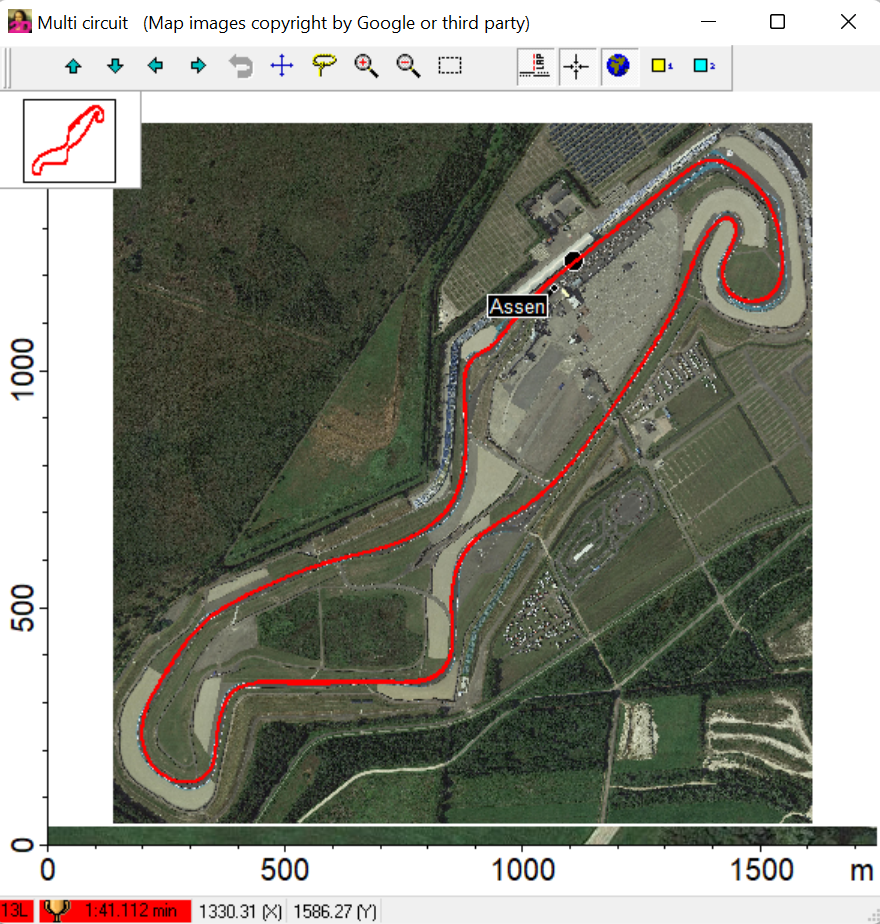
Multi-Circuit
Sub-menu
The sub-menu of Multi-Circuit window can be opened by right-clicking on Multi-Circuit window.
Important
Background images must only be loaded once from internet because then the background image is saved on computer.
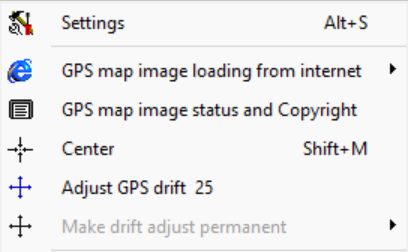
Multi-Circuit sub-menu
Settings:
Line: Changing line width
Color:
Setting any channel of measurement as color channel for drawing line
Important
Via Color Scale different options can be chosen for coloring the line.
Using Measurement color from Analyzer
Important
This option is important when multiple measurements are loaded in Analyzer!
AutoCenter: When active, center of Multi-Circuit is set by measurement cross in moving window
GPS map image loading from internet: Set mode of (re)loading background images from internet
GPS map image status and Copyrights: See image status (directory and name of image) as well as Copyright information
Center: Center Multi-Circuit position
Adjust GPS drift: When active, via key buttons the background image position can be adjusted (0 resets adjustments)
Make GPS drift permanent: Make GPS drift adjustments permanent
Circuit
Addtional manual
For more information about Circuit click here!
Min-/Max-table
A Min-/Max-table serves as a quick overview of minimum, maximum and average values of some channels of a measurement lap by lap.
Important
For every lap a new line is created!
Min-/Max-table can be opened via Analyzer-tab Functions, by pressing <Alt>+<m> or using Header window icon.
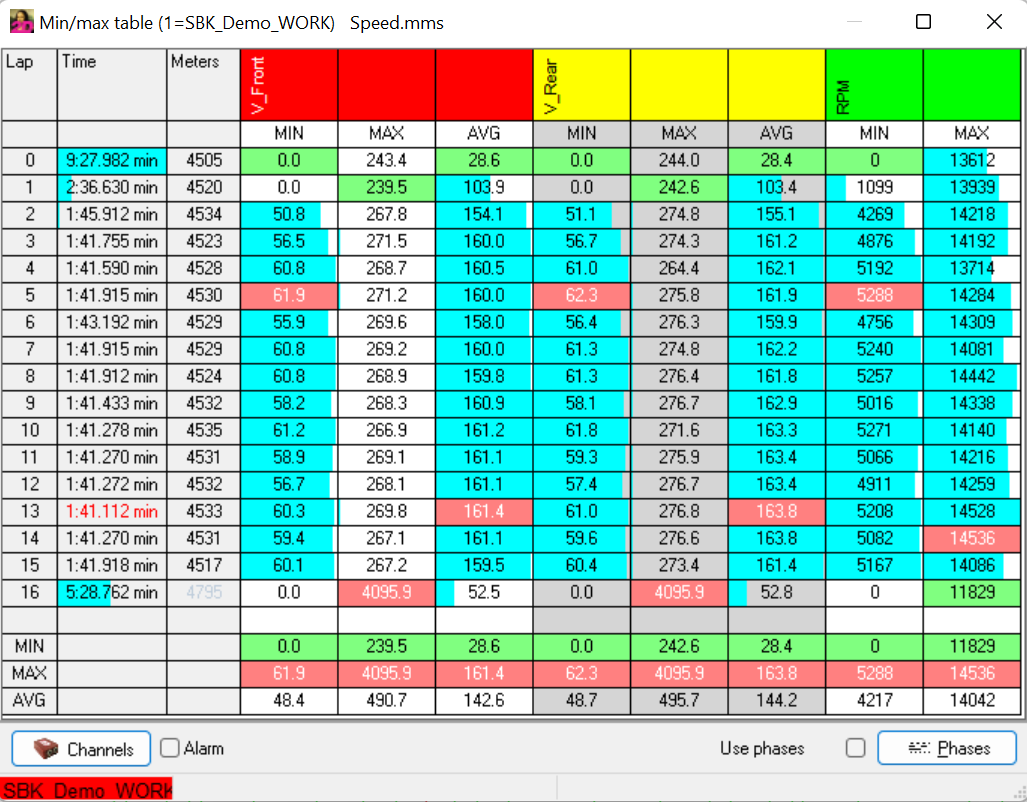
Min-/Max-table
Minimum and maximum values of respective columns are highlighted in green and red.
The percentage distribution of the values per column is shown in blue.
Attention
AVG-value on bottom of Min-/Max-table shows the average value only of the Min-/Max-table values per column!
Create Min-/Max-table
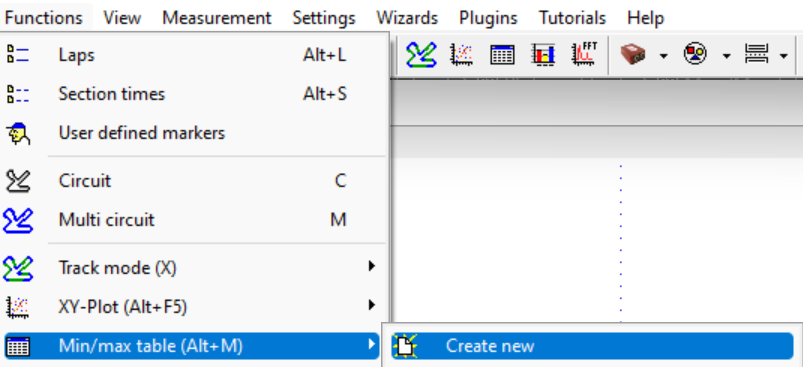
Create new Min-/Max-table
Edit Min-/Max-table
When creating a new Min-/Max-table or by clicking on button Channels channels can be added for displaying in Min-/Max-table.
Important
Also Special Channels can be selected as input channels to ensure generalization.
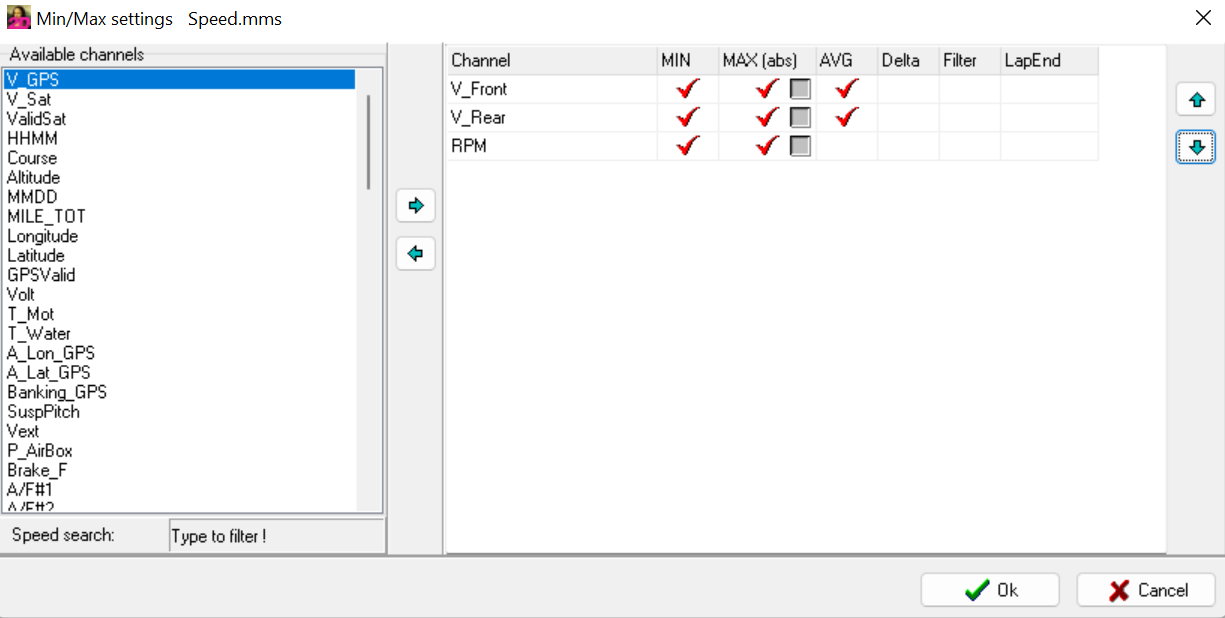
Select channels
Min: Minimum value of selected channel of respective lap
Max: Maximum value of selected channel of respective lap
Max (abs): Absolute maximum value of selected channel of respective lap
AVG: Average value of selected channel of respective lap
Delta: Difference between maximum and minimum value of selected channel of respective lap
Filter: Applying average filter to selected channel
LapEnd: Last value of selected channel of respective lap
Export Min-/Max-table
Via right-clicking and sub-menu Export the Export settings of currently opened MinMax table can be opened.
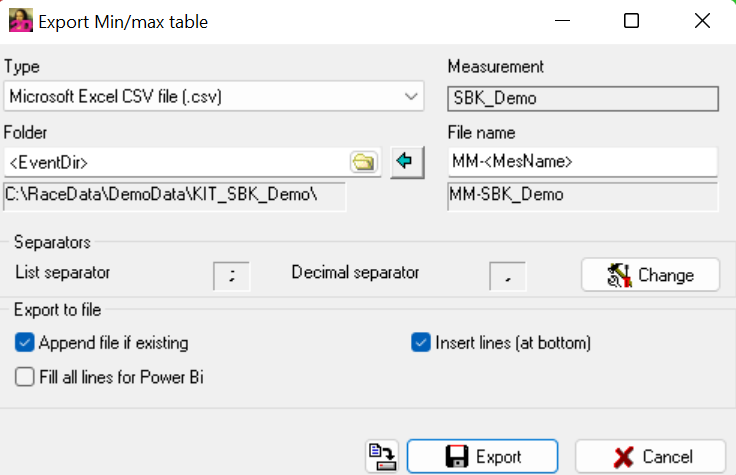
MinMax table export settings
Type: Chosing file type for export file
File name: Defining file name of exported file (placeholders can be used)
Folder: Defining folder where exported file is saved (placeholders can be used)
Seperators: Selecting list and decimal seperators for exported file
- Export to file:
- Append file if existing: When checked, at export in directory to export a file with same name specified in export settings is found, this file is used also used for current export
Attention
When not checked and at export with same name specified in export settings is found, the file is overwritten with exported file!
- Insert lines (at bottom): When checked, at file with same name, the new lines are inserted directly after last data line.
Attention
Only important when after data lines a bottom line with text is used!
Fill all lines for PowerBI: When checked, all lines (event and measurement names fields) are also filled.
Save Export Settings: Save export settings
Export: Export MinMax table
X-Y-Plots
Function to display a 2-dimensional graphical presentation of the relationship of 2 channels. A XY Plot can graphically show the relationship of one selectable channel (X) to several other (Y) selectable channels.
Important
A 3rd dimension is achieved by selecting a color channel.
Min-/Max-table can be opened via Analyzer-tab Functions, by pressing <Alt>+<F5> or using Header window icon.
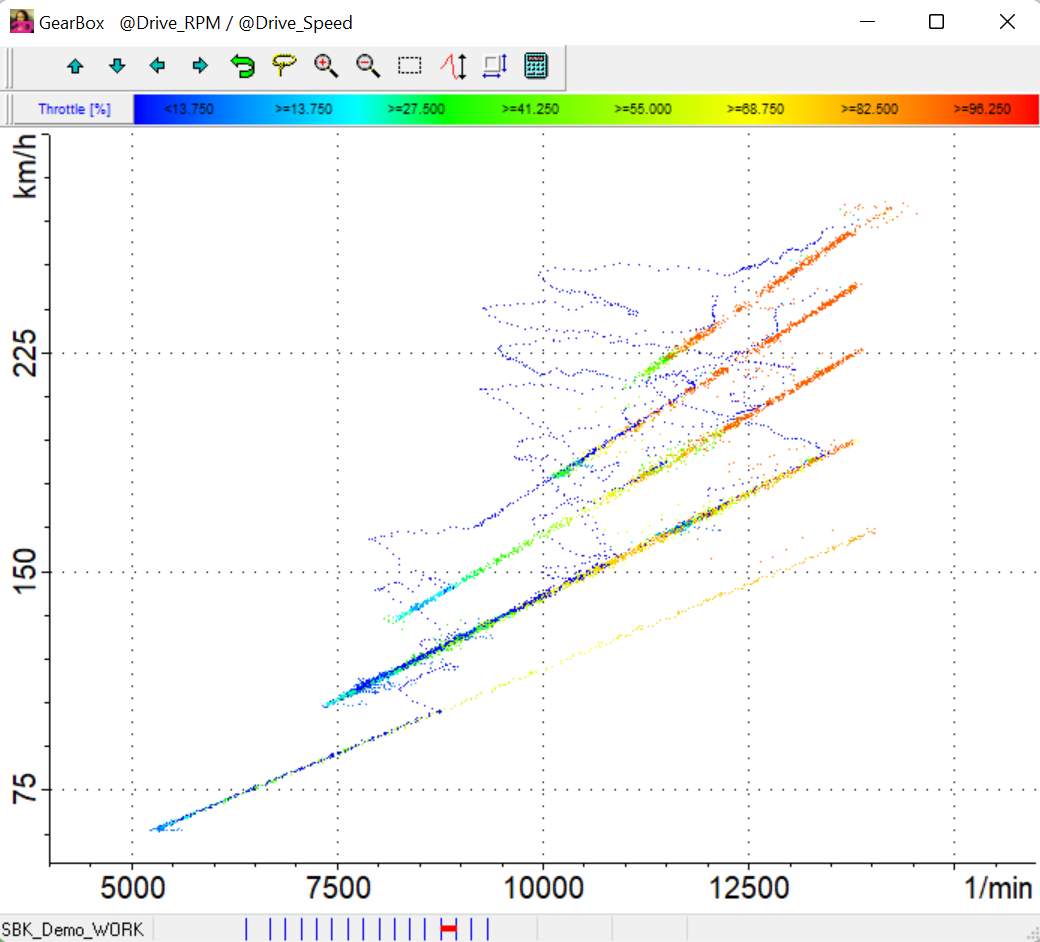
XY-Plot with RPM over rear wheel speed with 3rd dimension as color channel only of fastest lap.
Important
Also Special Channels can be selected as input channels to ensure generalization.
Create XY-Plots
Create new XY-Plot
Edit XY-Plots
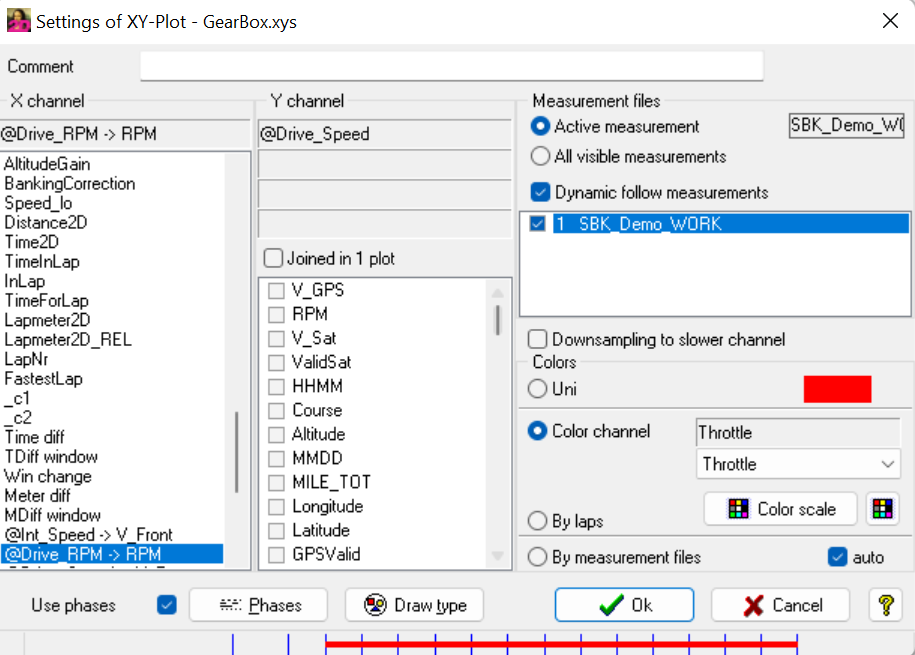
XY-Plot setting menu
X channel: Selecting channel for X axis
Y channel: Selecting channel(s) for Y axis
Attention
Up to four channels can be selected for Y channels. With active checkbox Joined in 1 plot all Y-Axis displayed in one XY-Plot.
Measurement files - Activate measurement: Even if multiple measurements are loaded in Analyzer, this XY-Plot only shows data from currently active measurement - All visible measurements: When multiple measurements are loaded, XY-Plot data is differentiated by measurement colors
Colors - Uni: XY-Plot data is shown in measurement color - Color Channel: Setting any channel of measurement as color channel for drawing line
Important
Via Color Scale different options can be chosen for coloring the lines.
By laps: For every lap of currently loaded measurement another color is used for drawing XY-Plot data
By measurement file: XY-Plot data is shown in measurement color
Important
Important when using option All visible measurements
Draw type

Different available draw types of XY-Plot
Topbar
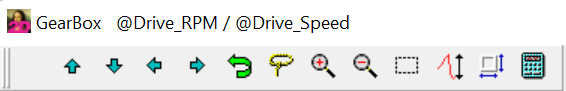
XY-Plot top bar
Up, Down, Left, Right: Adjusting positions of XY Plot data
Undo: Undo last change
Catch: Set suitable limits for currently shown data
Zoom in & Zoom out: Zoom in and out XY-Plot data
Select: Select area of XY-Plot to be displayed
Edit limits: Set limits manually
Fixed Ratio: Fix ratio of axes
Dynamic autoposition: Automatic catching when current selection and thus XY-Plot data changes
Histogram
A histogram is a graphical representation of the distribution of numerical data of a channel.
Important
It is an estimate of the probability distribution of a channel data considered as a continuous variable. To construct a histogram, the first step performed by 2D software is to “bin” the range of values of the selected channel - that is, divide the entire range of values into a series of intervals - and then count how many values fall into each interval. The bins are usually specified as consecutive, non-overlapping intervals of a variable. The result is a frequency of occurrence (~ a probability) for the instantaneous value of a channel to fall in one specific bin.
Min-/Max-table can be opened via Analyzer-tab Functions, by pressing <Alt>+<F1>.
Important
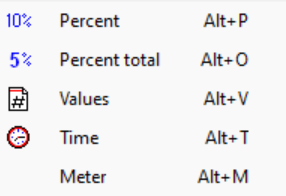
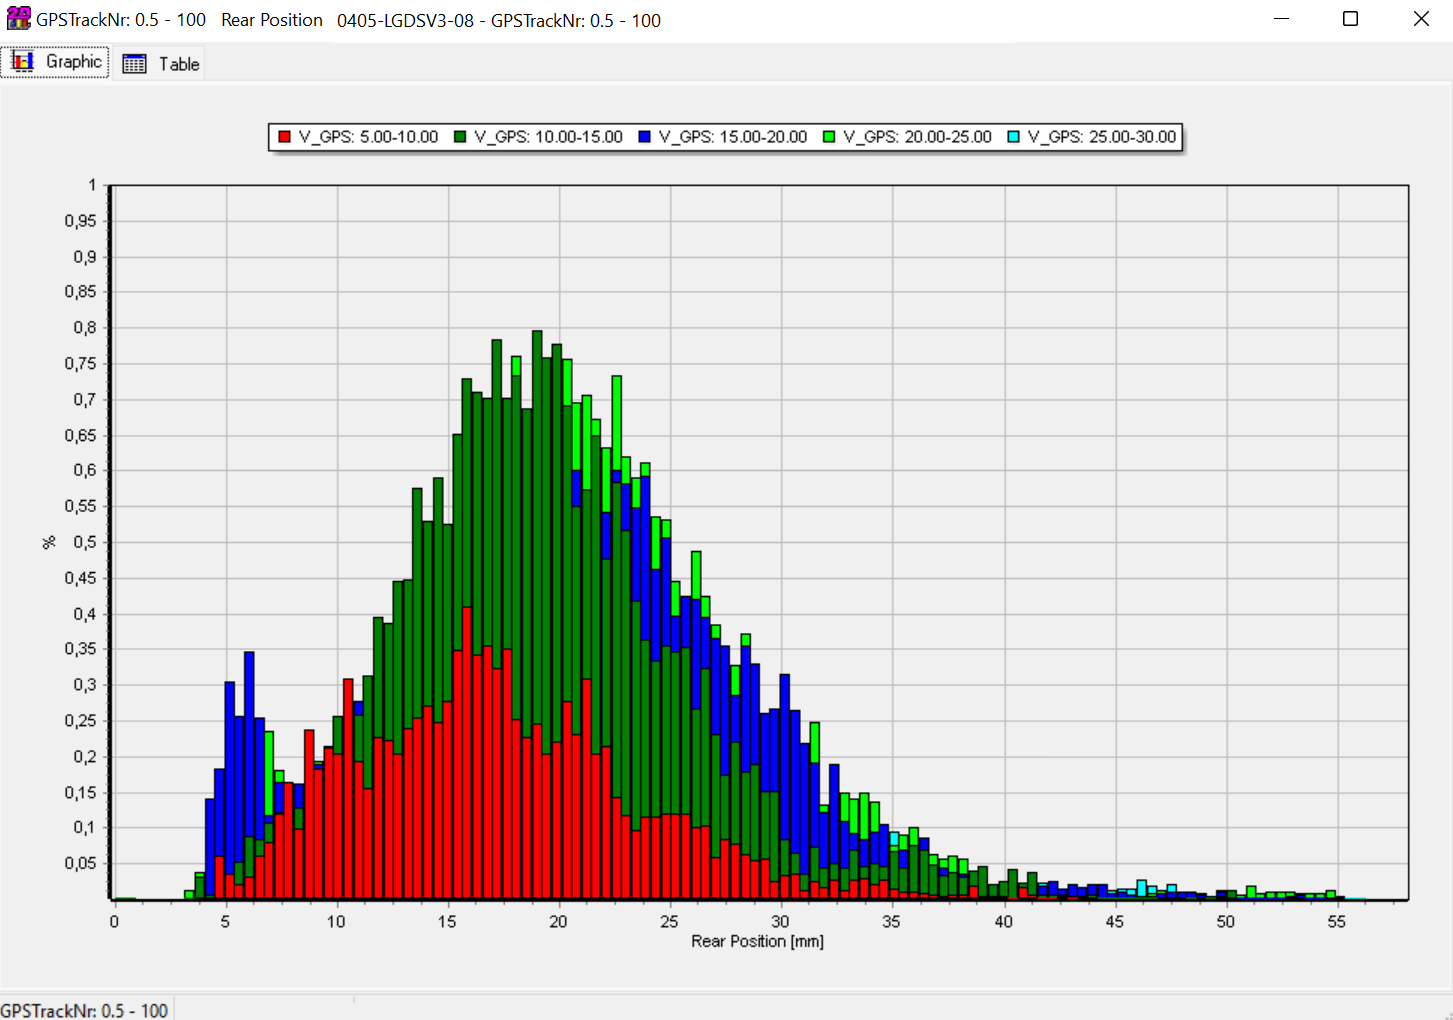
Histogram are very suitable when it comes to suspension data analysation.
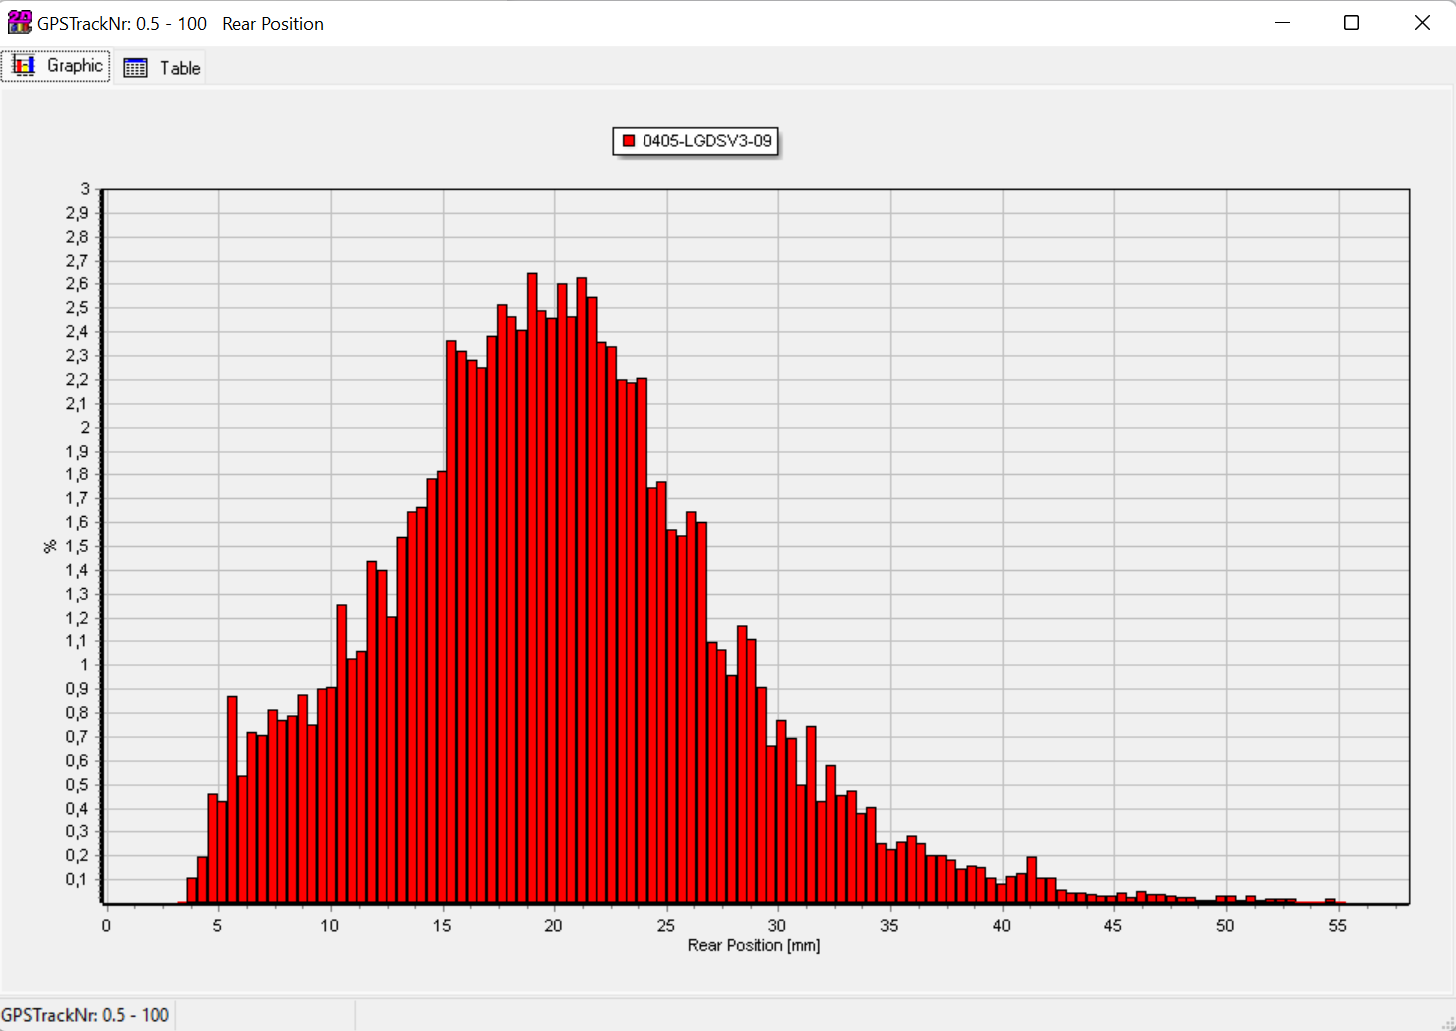
Comparison of rear suspension sensor data from mountainbike with two measurements
Histogram Settings
Important
Histogram settings can be opened via right-clicking on histogram window.
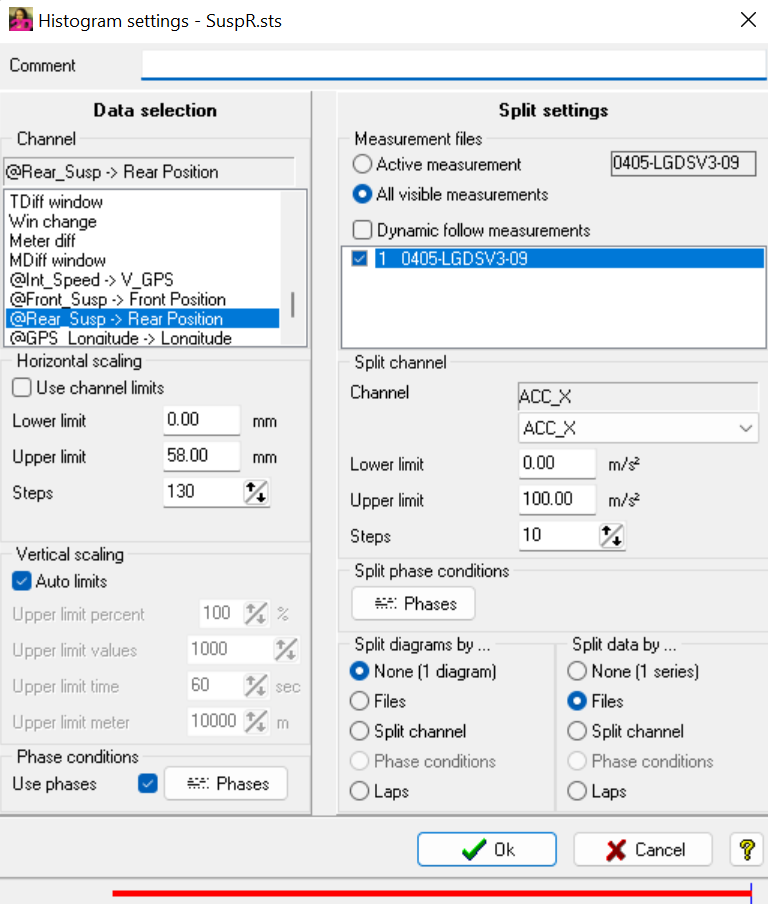
Histogram settings
Channel: Choose histogram input channel
Horizontal scaling: Choose channel value range and number of subdivision (Steps) for creating the bins
Vertical scaling: Select auto limits or choose manual scaling
Measurement files: Select the files to display
Split channel: Create multiple histograms using the split channel
Split phase conditions: Devide diagrams or series by single phase conditions
- Split diagram by: Select options how histogram should be displayed
None (1 diagram): Use only one histogram window for displaying data
Files: If multiple measurements are loaded in Analyzer, for every measurement an own histogram window is shown
Split channels: Activate if obove described split channels should be used to create multiple histogram windows depending on split channel setting
Phase conditions: Reducing range of data (e.g., displaying histogram from rear suspension sensor with data from whole phase (e.g., fastest lap) but only when speed is between 100 and 150 km/h)
Laps: Split diagram by laps
- Split data by:
None (1 diagram): Use only one histogram window for displaying data
Files: When multiple measurements are loaded in Analyzer, overlay all histograms
Split channels: Activate if obove described split channels should be used to split data from histogram windows depending on split channel setting
Phase conditions: Reducing range of data (e.g., displaying histogram from rear suspension sensor with data from whole phase (e.g., fastest lap) but only when speed is between 100 and 150 km/h)
Laps: Split data by laps
Graphic Settings
With Graphic settings various graphical elements of histogram window (background image, bars, lines, …) can be changed.
Important
Graphic settings can be opened via right-clicking on histogram window.
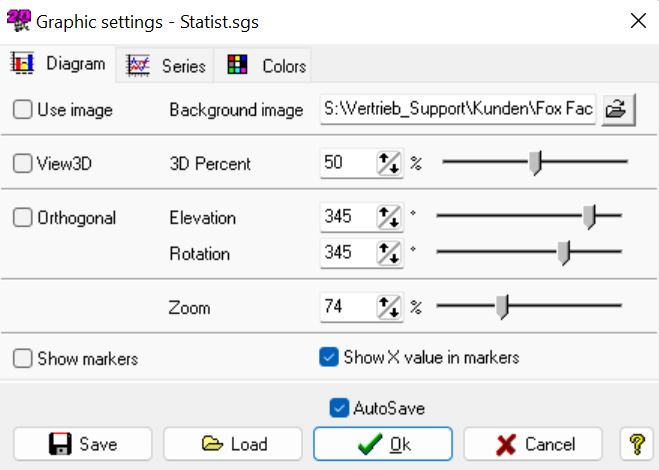
Graphic settings
View type
With View type type of Y-axis can be changed between Percent, Percent total, Values, Time and Meter
View type settings
Examples
Split Histogram data of rear suspension sensor data from mountainbike by speed channel
Overlay Histogram of rear suspension sensor data from mountainbike of two measurements
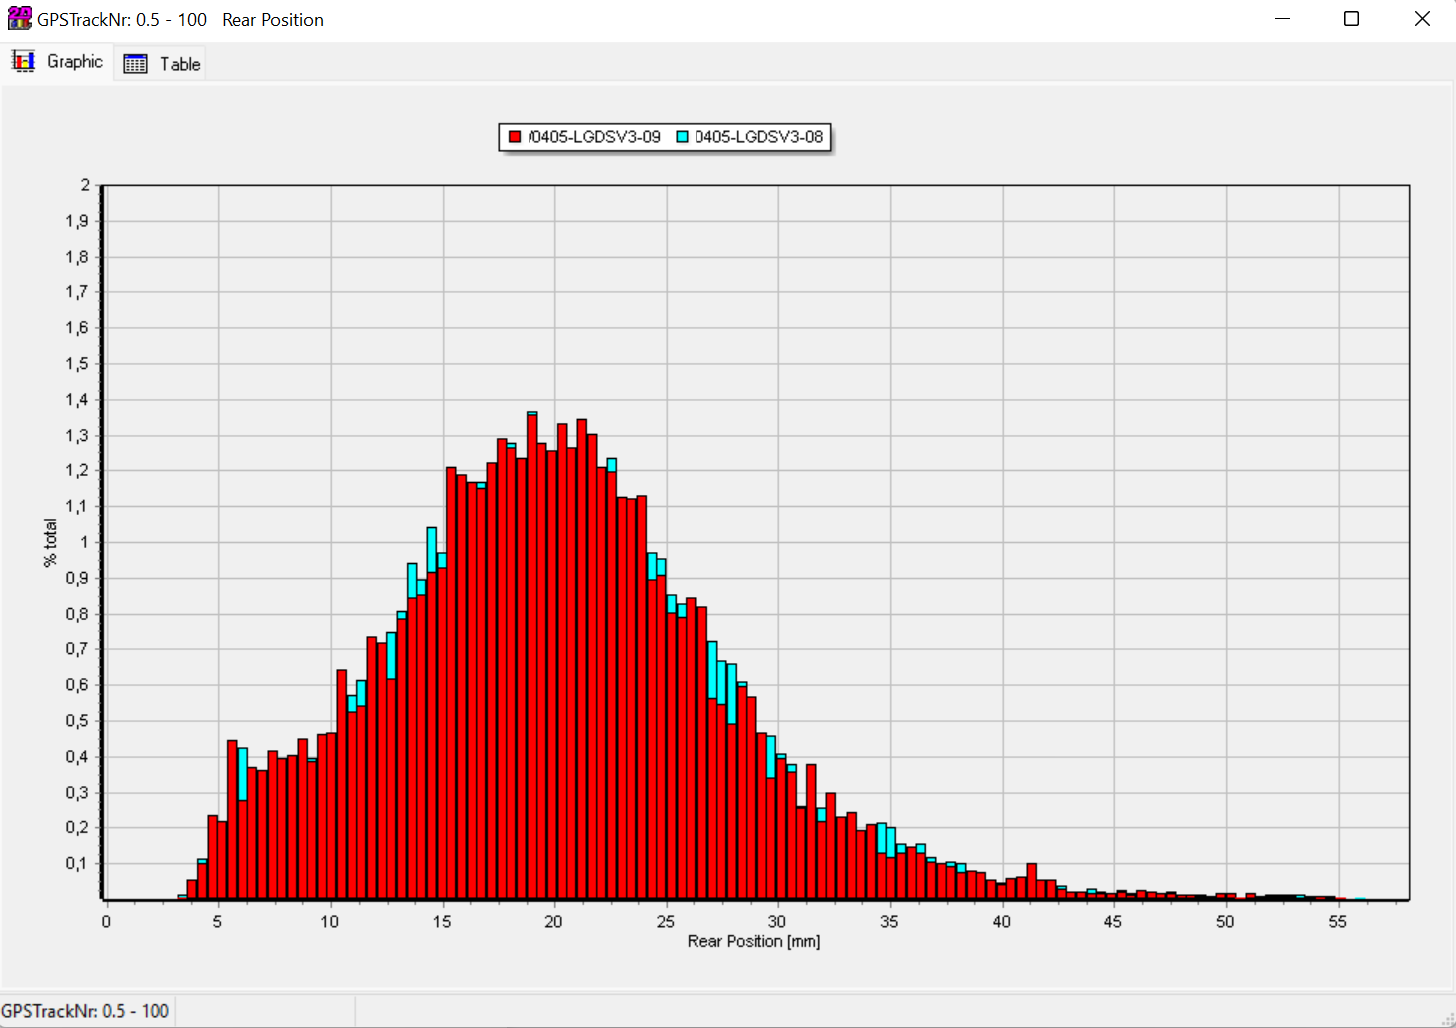
Throttle actuation only in fastest lap with RPM as data split channel
FFT
A fast Fourier transform (FFT) algorithm computes the discrete Fourier transform (DFT) of a sequence, or its inverse.
Fourier analysis converts a signal from its original domain (often time or space) to a representation in the frequency domain and vice versa.
Track mode
Graphical presentation of track with channel values at defined positions.
Track mode can be opened via Analyzer-tab Functions, by pressing <x>.
Important
A 3rd dimension is achieved by using a so-called color channel.
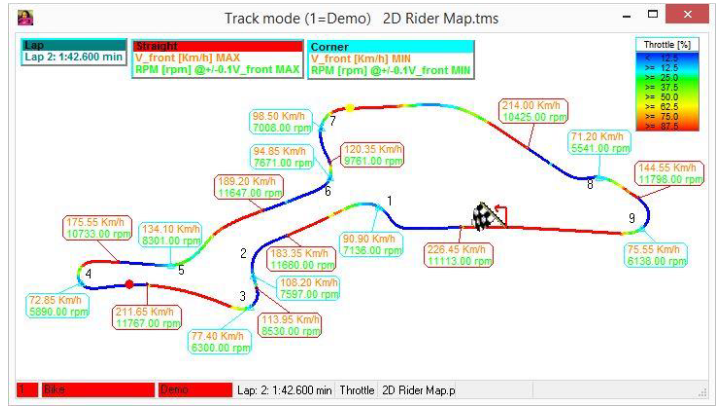
Track Mode example
Status Bits
With Status bits tool bits of channels can be linked to an text information.
Important
Status bit always shows values of current cursor position in moving window.
Status Bits can be opened via Analyzer-tab Functions.
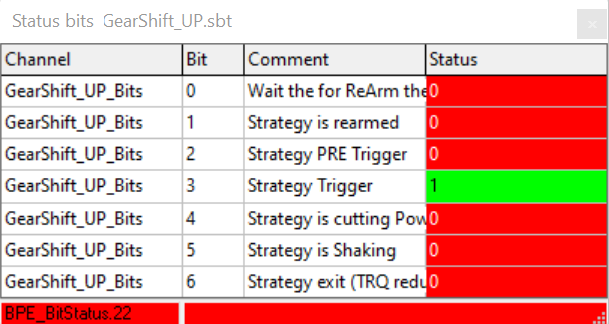
Status Bits window
Example:
Status Bits at current cursor position in moving window
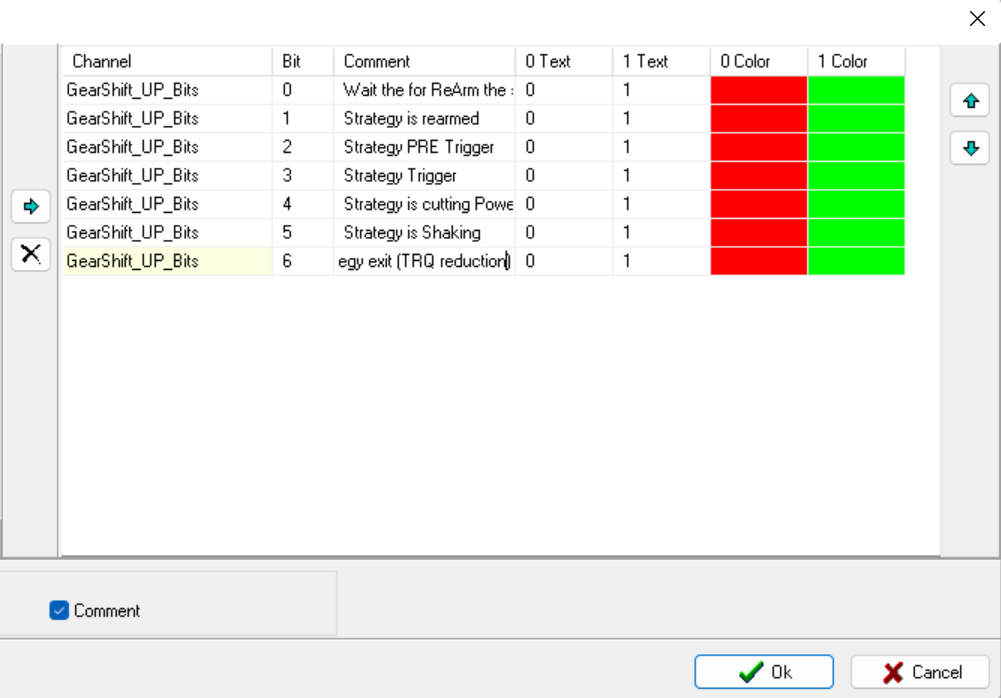
Status Bits setting
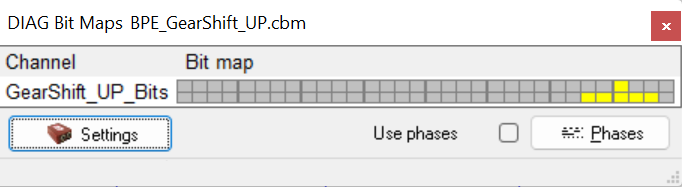
DIAG Bit Maps
With DIAG Bit Map tool bits of channels are displayed in coloured boxes on current cursor position (first line) and over whole measurement (second line).
Important
First line shows bit value on current cursor position in moving window. Second line shows bit value over whole measurement, to see if bit is TRUE somewhere in measurement.
DIAG Bit Map can be opened via Analyzer-tab Functions.
DiIAG Bits window
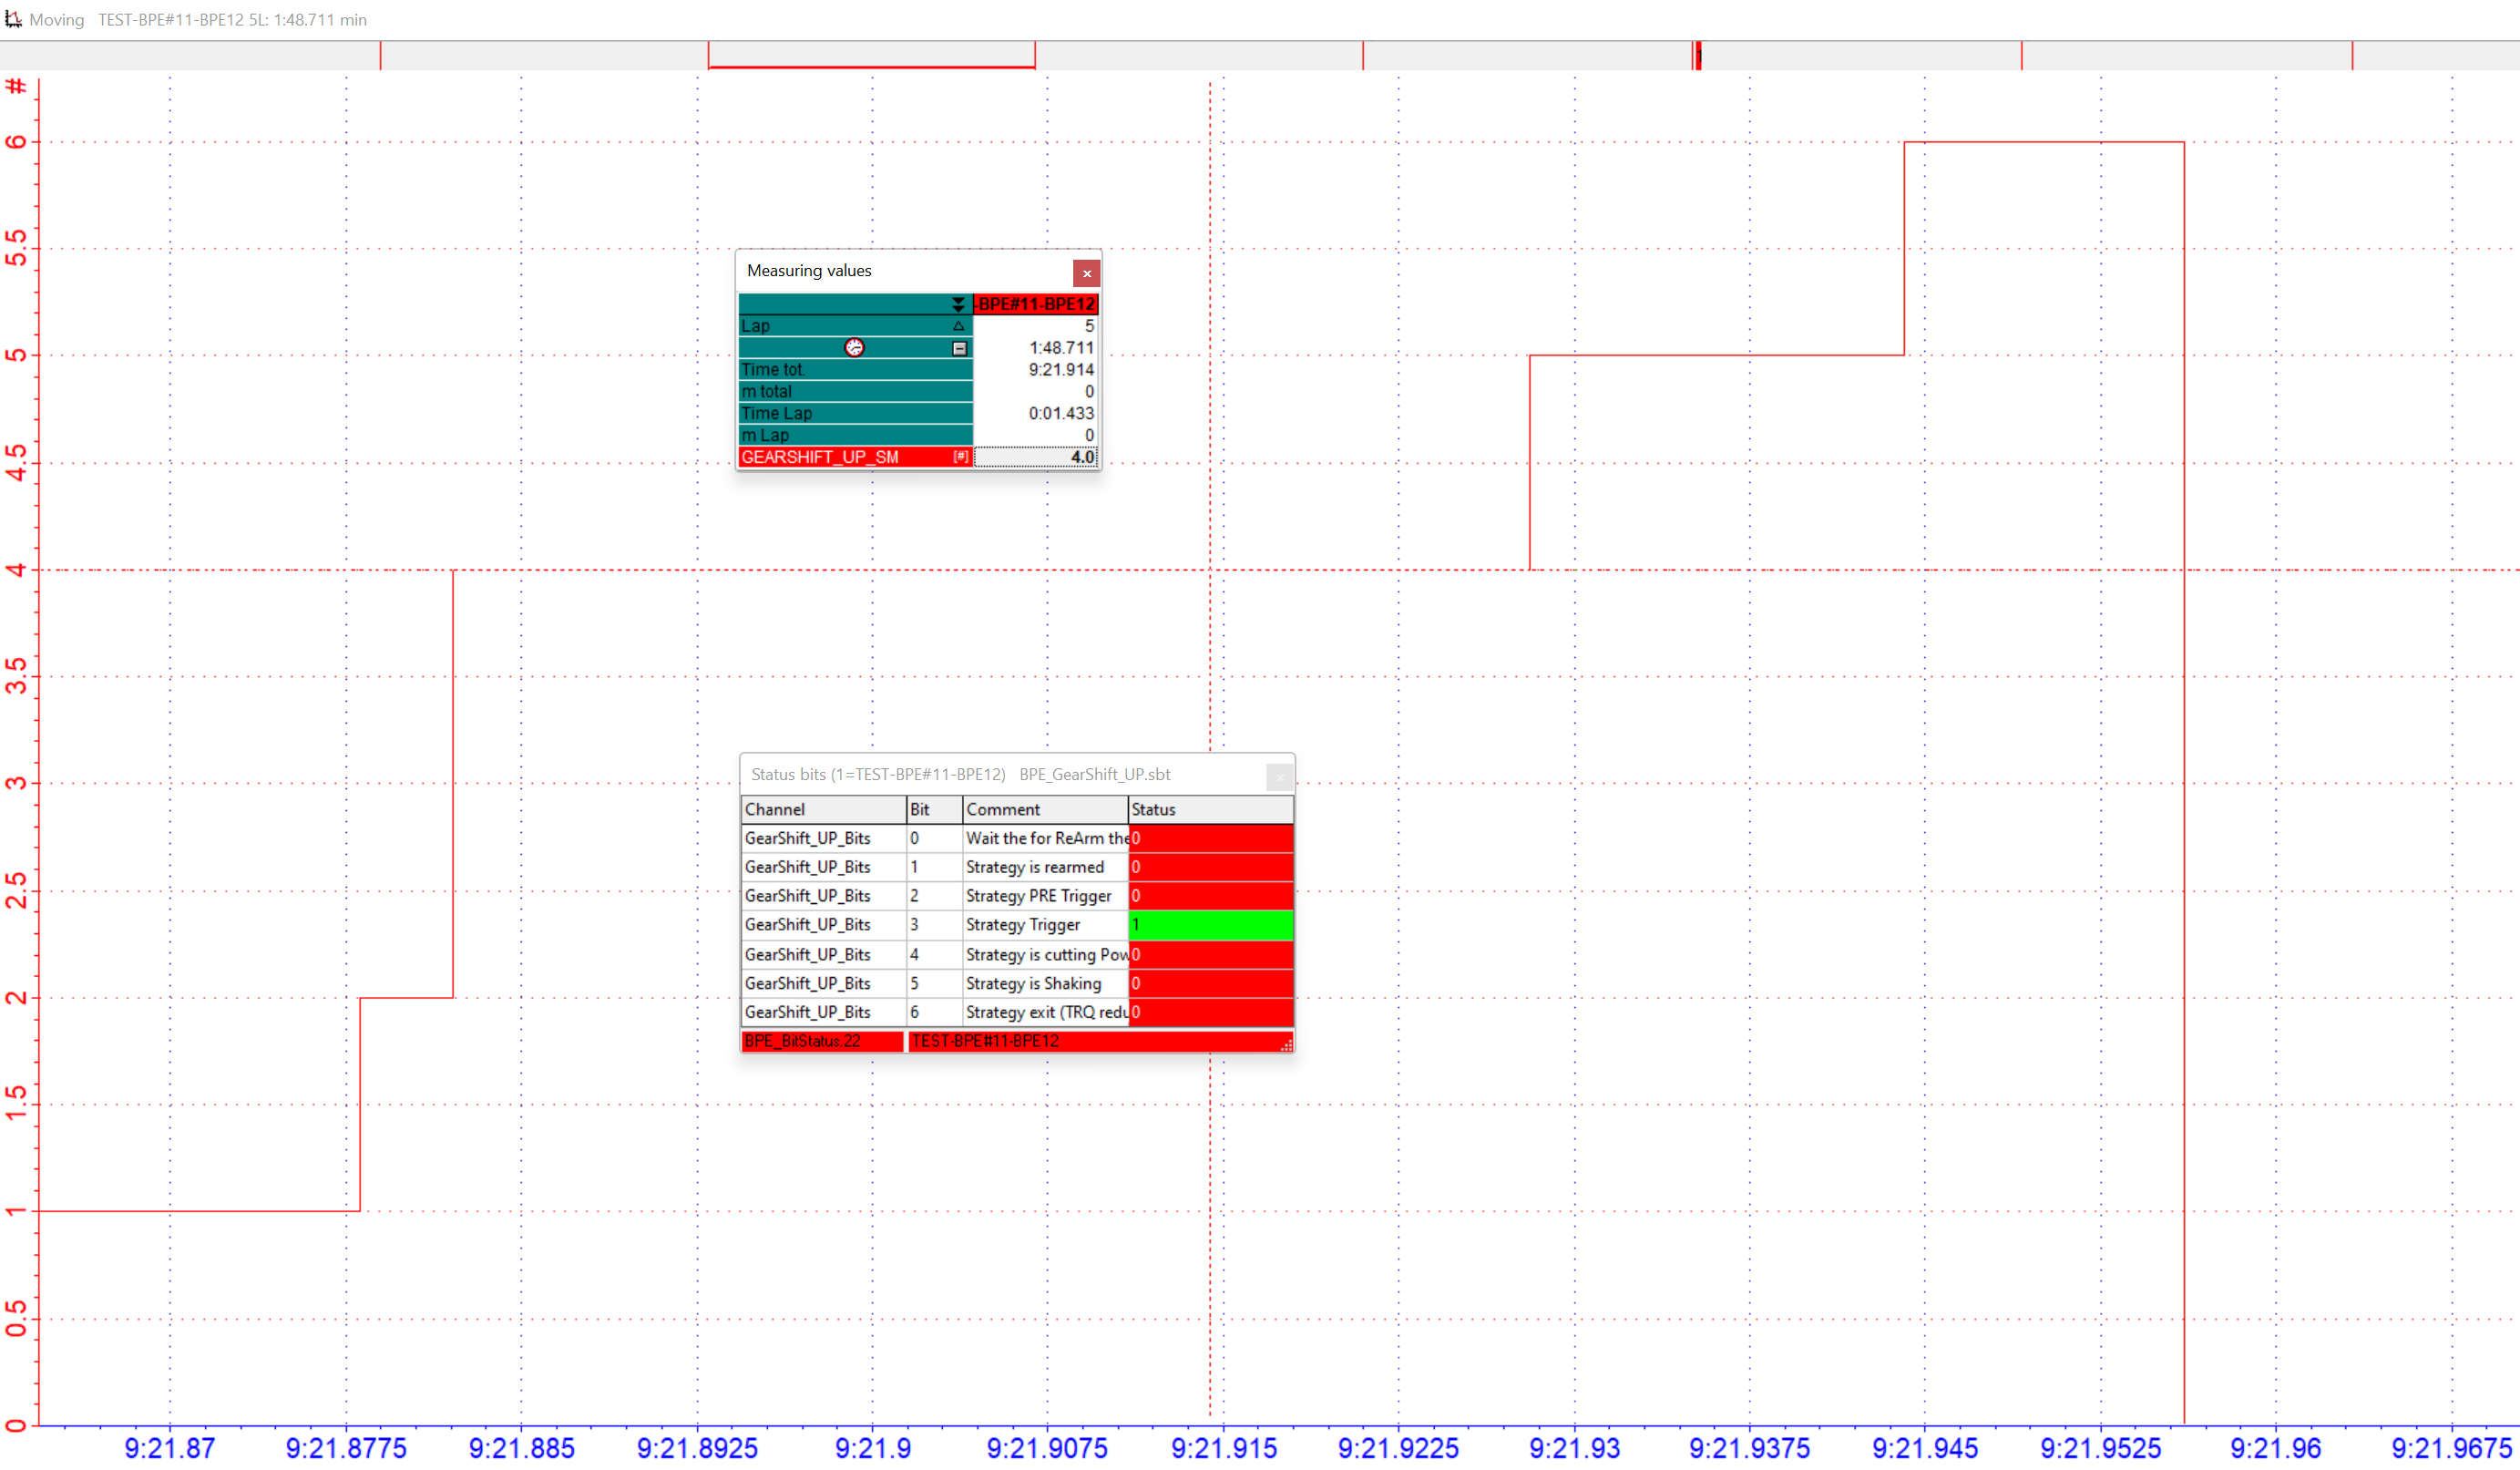
Example: Status Bits & DIAG Bit Map
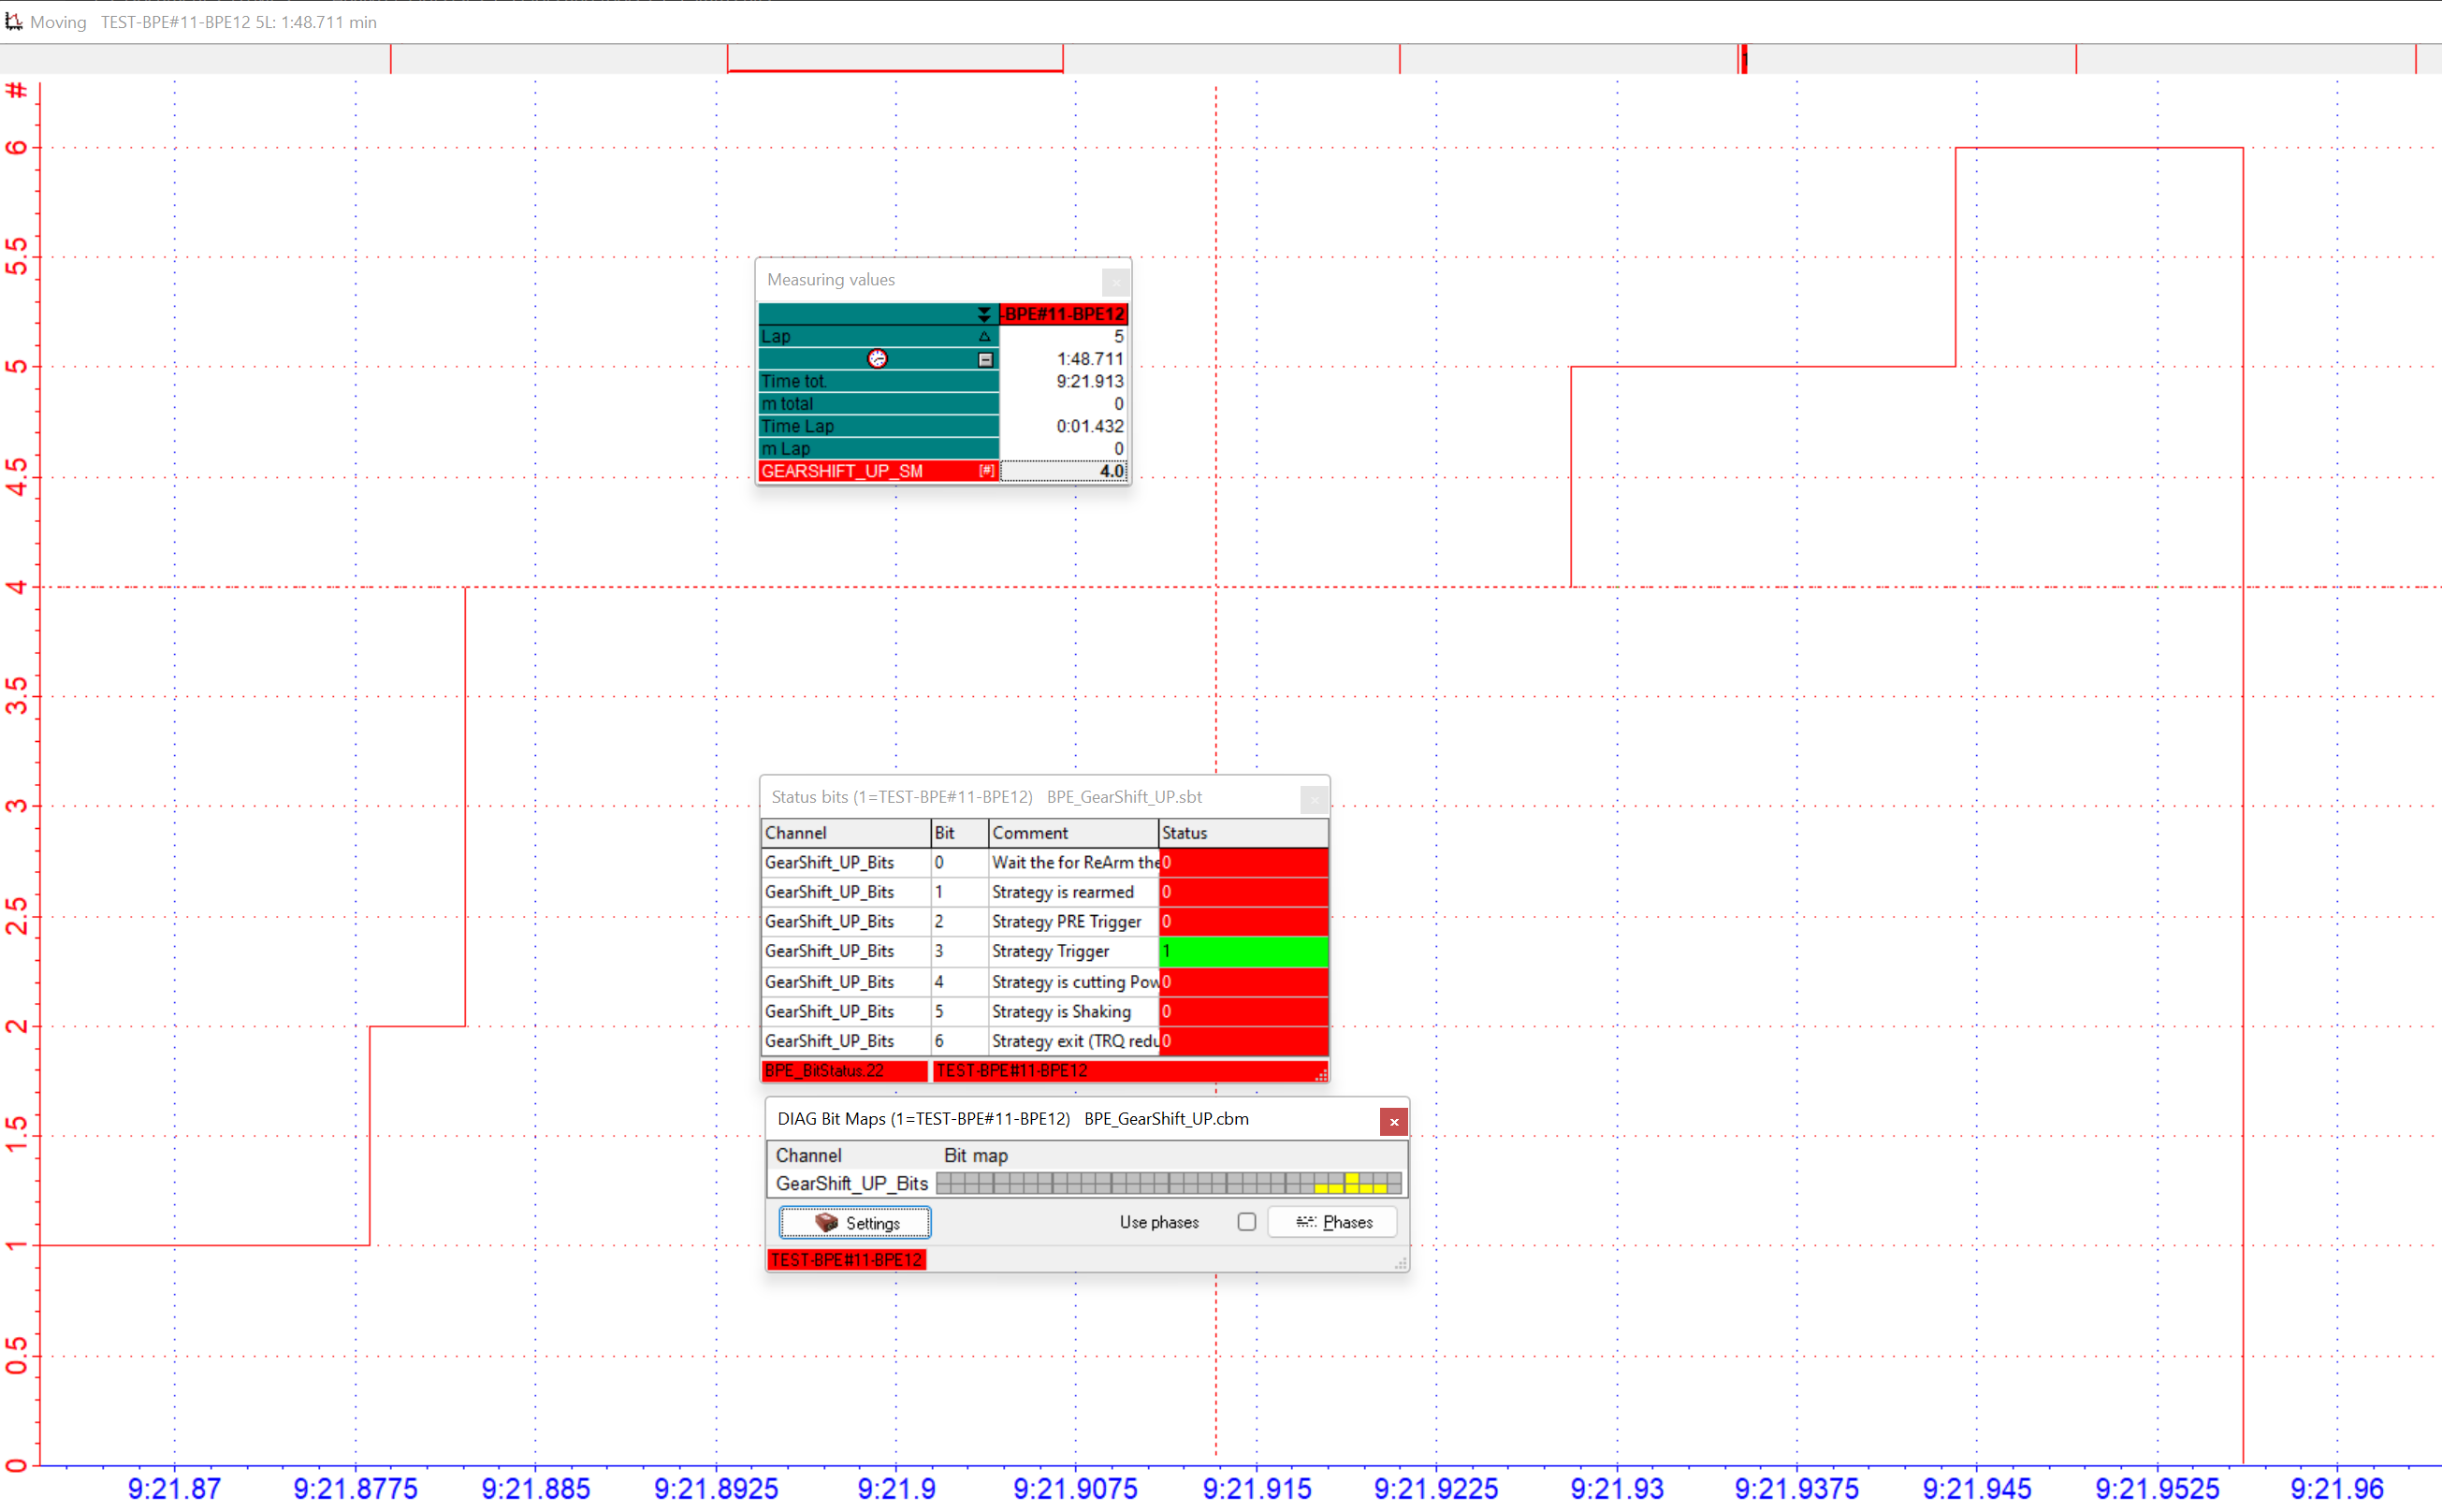
DIAG Bit Map and Stauts Bits at current cursor position in moving window
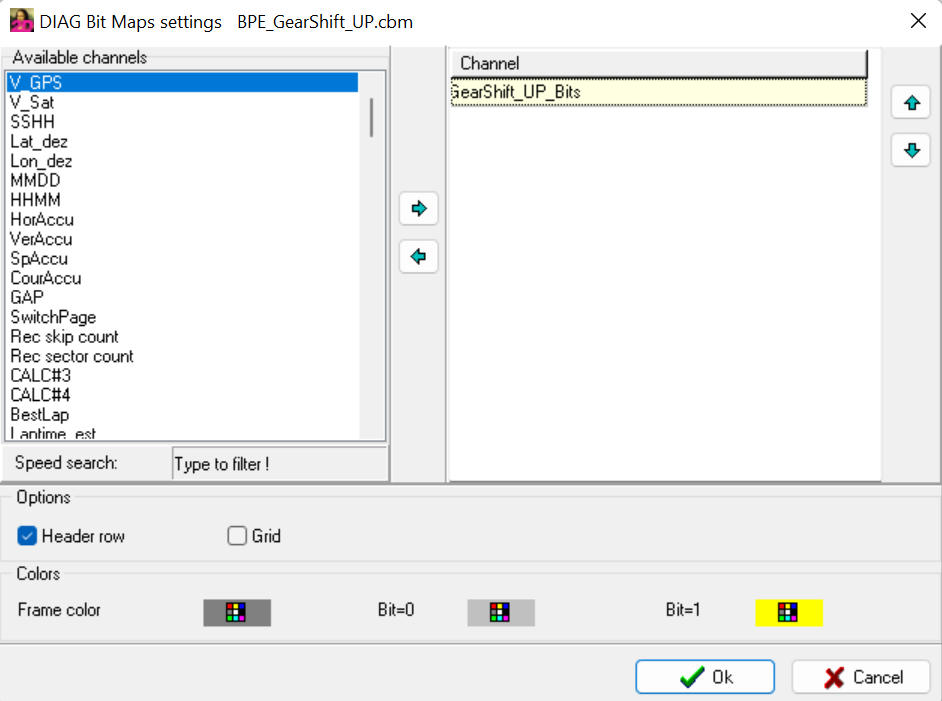
DIAG Bit Map setting
Important
Different colors for DIAG Bit Map fields can be chosen.
Dynamic Test System (DTS) - DTS Tool
The Dynamic Test System software tool (DTS Tool) allows for a fast, table-oriented overview of the already recorded measurements in regard to dynamic vehicle testings (Brake Tests, Acceleration Tests, ELK Test, Slalom) on computer.
Important
Analyzer DTS Tool can be used execute dynamic vehicle data evaluations with every set of measurement data (Automotive testings, RaceTrack data for vehicle or driver analysations.
Output of Analyzer DTS Tool is a report window with all important information to set tests (Brake time, brake distance, max. accereleration, MFDD, …) which can be exported als Excel file.
Addtional manual
For more information about DTS Tool please see https://2d-datarecording.com/Downloads/Manuals/AC-DOC_DTS_Tool_Manual.pdf
Addtional manual
Beside analyzing already recorded measurements (DTS Tool) 2D also provides a DTS System to record and live display dynamic testing results on a 2D display to the driver! For more information about DTS System please see https://2d-datarecording.com/Downloads/Manuals/AC-DOC_DTS_Manual.pdf